The 10-year/3-month #Treasury yield spread is about to print a reversal doji on the 6-month chart.
Typically recessions (shaded in red) begin when this spread moves substantially higher.
Earlier this year, the NY #Fed, using this chart as a recession predictor, placed the odds of a U.S. #recession starting by May 2024 at 70%. This was the strongest recession signal in over 40 years.
 See more here:
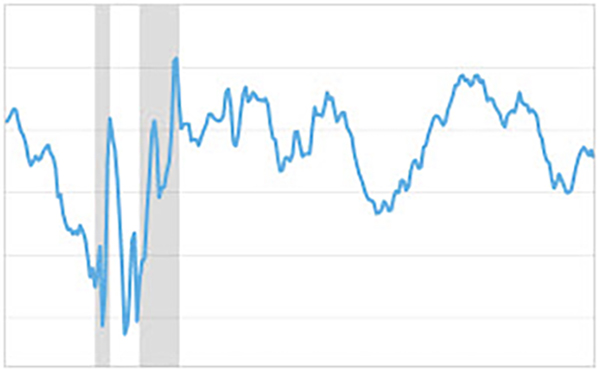
See more here: The Yield Curve as a Leading Indicator
This model uses the slope of the yield curve, or the “term spread” between long- and short-term interest rates, to calculate the probability of...
