Momentum Strategies And Physics: Mass And Velocity Matter
Momentum Strategies And Physics: Mass And Velocity Matter
In his 1687 book, Philosophiae Naturalis Principia Mathematica, Sir Isaac Newton defined momentum as the product of mass and velocity, or p = m * v. The reason we begin with a physics lesson is that momentum strategies are very popular, and Isaac Newton’s famous formula can teach us a lot about financial asset momentum.
Recently, we have seen rapid shifts in and out of various sectors and stock factors that disrupt momentum strategies. Therefore, understanding how momentum strategies work can help you better identify when they might be effective and when it’s time to switch to a different approach.
The graphs used in this article are from 8/21/2025. Although slightly outdated, their goal is to help readers understand how to measure momentum rather than assess the current momentum state.
Physics 101
Returning to our basic physics formula, p = m * v.
To measure financial momentum, we also need to measure the velocity and mass of a financial asset or index.
Mass
Mass (m) in finance terminology refers to the trading volume or market interest behind an asset. Market cap or AUM, trading volumes, and investor sentiment can be used to measure mass.
The graph below, courtesy of https://www.simplevisor.com/tvcharts
, highlights the bullish trend channel (blue) from late May through mid-August.
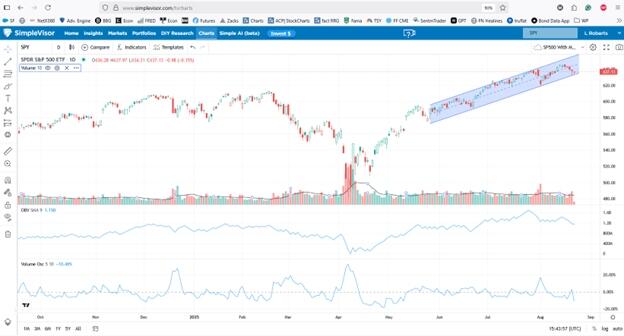 In this example, we will focus on three indicators to evaluate mass.
The first indicator is volume, along with its moving average. As indicated by the red and green bars, volume has remained steady throughout the trend. This is also supported by the relatively flat moving average (black line). Ideally, we want to see rising volume alongside a trend. However, volume isn’t decreasing either, which would suggest the trend is losing momentum.
The middle graph is On Balance Volume (OBV). OBV adds volume on days when a security’s price closes higher and subtracts volume when it closes lower. Therefore, it shows a running total of buying or selling pressure. Ideally, we want to see it increasing. Like we noted with volume, which is also flat, OBV momentum isn’t gaining strength, but it doesn’t indicate that momentum is declining either.
The bottom graph shows the Volume Oscillator, which compares a shorter and a longer moving average of volume. When it declines, it indicates that volume over the shorter moving average period is less than that of the more extended period. As shown above, the oscillator has been declining, though at a slow rate.
None of the volume indicators suggest a break in the momentum trend is imminent, but they also don’t indicate the trend is gaining strength.
Velocity
Velocity (v) quantifies the persistence of the trend and its slope.
Let’s revisit the graph above with three popular indicators of velocity.
In this example, we will focus on three indicators to evaluate mass.
The first indicator is volume, along with its moving average. As indicated by the red and green bars, volume has remained steady throughout the trend. This is also supported by the relatively flat moving average (black line). Ideally, we want to see rising volume alongside a trend. However, volume isn’t decreasing either, which would suggest the trend is losing momentum.
The middle graph is On Balance Volume (OBV). OBV adds volume on days when a security’s price closes higher and subtracts volume when it closes lower. Therefore, it shows a running total of buying or selling pressure. Ideally, we want to see it increasing. Like we noted with volume, which is also flat, OBV momentum isn’t gaining strength, but it doesn’t indicate that momentum is declining either.
The bottom graph shows the Volume Oscillator, which compares a shorter and a longer moving average of volume. When it declines, it indicates that volume over the shorter moving average period is less than that of the more extended period. As shown above, the oscillator has been declining, though at a slow rate.
None of the volume indicators suggest a break in the momentum trend is imminent, but they also don’t indicate the trend is gaining strength.
Velocity
Velocity (v) quantifies the persistence of the trend and its slope.
Let’s revisit the graph above with three popular indicators of velocity.
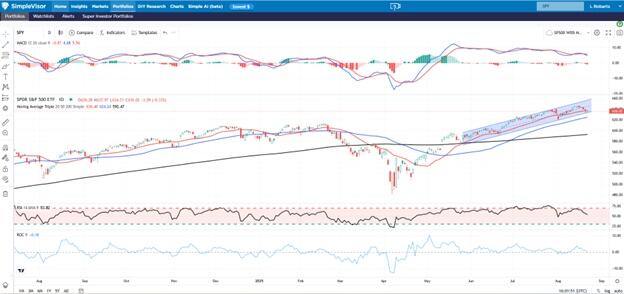 The graph shows the Moving Average Convergence Divergence, or MACD. The MACD is computed by subtracting a longer-term moving average from a shorter-term one. Additionally, a signal line, an even shorter moving average, accompanies the MACD. We examine not only the trend and level of the MACD but also convergences or divergences from the signal line. A convergence indicates a weakening trend, while divergence suggests increasing momentum. In the graph, the MACD remains stable with no apparent signs of convergence or divergence. Although generally bullish, the MACD level is high, which is difficult to sustain, and it has been gradually sloping downward.
The indicator just below the price chart is the Relative Price Index, or RSI. The RSI is an oscillator that measures the speed and magnitude of price movements. The index ranges from 100, which signals it’s very overbought, to 0, indicating it is very oversold. Typically, levels above 75 and below 25 suggest a reversal in momentum is likely. Equally important is the trend of the RSI line. Like most indicators, we prefer a gently rising or falling trend over sharp movements. Currently, after reaching overbought levels in late July, the RSI has generally been declining, showing that momentum is weakening.
Last is the Rate of Change (ROC). The ROC calculation shows the percentage difference between the current price and an earlier price. An ROC of zero, as indicated by the graph, means the price has not changed compared to 9 days ago. ROC should be above zero in an uptrend and below zero in a downtrend. However, during healthy market consolidations, the ROC can reach zero. In such cases, breaking below zero could coincide with breaking the highlighted price channel and a change in momentum.
What Is p?
Before moving on, let’s review the momentum of the S&P 500 based on the indicators and charts above. The highlighted trend channel, along with the mass and velocity indicators, suggests a market with positive momentum. Both sets of indicators are indicating some easing of momentum but not warning of an upcoming reversal. As we mentioned earlier, it’s healthy to experience brief periods of correction or consolidation in strong upward trends. So far, we should assume this is the case until our indicators and the price chart indicate otherwise.
Pitfalls of Momentum Strategies
Momentum strategies depend on the persistence of price trends and indicators that measure those trends, some of which are described above. When markets undergo significant two-way volatility or rapid rotations with market leadership shifting quickly between sectors and/or stock factors, momentum strategies often face difficulties.
The biggest problem with the strategy is its delayed reaction. Because momentum strategies rely on past price data, trends may reverse or fade before the strategy can fully take advantage of them, resulting in whipsaw losses. Additionally, the model might not detect a new momentum trend until it is well into the cycle, leaving little upside potential.
Another important factor is time. If you plan to follow a momentum strategy, you must decide whether you’re a short-term trader or a medium- or long-term investor. A short-term trader might use minute-by-minute data to capitalize on momentum trends over hours or days. Long-term traders, on the other hand, need to focus on the bigger picture. Naturally, the scope of that picture depends on how long-term an investor you are.
Mitigating Data Lag
When markets are volatile and rotations occur quickly, momentum can still be effective. Still, strategies need to adjust to the environment. For example, you may want to use shorter lookback periods to capture momentum changes more quickly.
Another practical step is diversification. Instead of depending on just one or two sectors, factors, or stocks with strong momentum, think about broadening your portfolio. This can help reduce the volatility of your returns. Additionally, including other value factors, such as market capitalization, beta, or value versus growth, alongside the momentum indicator, can result in more stable outcomes.
Summary
Momentum strategies give investors the chance for higher returns than the market. Additionally, momentum can be fairly easily measured, allowing investors to use a rule-based system, which can help reduce the influence of emotions on trading decisions.
Momentum strategies, like all other investment strategies, have periods when they perform well and periods when they underperform. For example, during periods of quick rotations where momentum trends are not sustained and volatility is high, investors can often find themselves on the wrong side of momentum.
We leave you with the graph below.
The graph shows the Moving Average Convergence Divergence, or MACD. The MACD is computed by subtracting a longer-term moving average from a shorter-term one. Additionally, a signal line, an even shorter moving average, accompanies the MACD. We examine not only the trend and level of the MACD but also convergences or divergences from the signal line. A convergence indicates a weakening trend, while divergence suggests increasing momentum. In the graph, the MACD remains stable with no apparent signs of convergence or divergence. Although generally bullish, the MACD level is high, which is difficult to sustain, and it has been gradually sloping downward.
The indicator just below the price chart is the Relative Price Index, or RSI. The RSI is an oscillator that measures the speed and magnitude of price movements. The index ranges from 100, which signals it’s very overbought, to 0, indicating it is very oversold. Typically, levels above 75 and below 25 suggest a reversal in momentum is likely. Equally important is the trend of the RSI line. Like most indicators, we prefer a gently rising or falling trend over sharp movements. Currently, after reaching overbought levels in late July, the RSI has generally been declining, showing that momentum is weakening.
Last is the Rate of Change (ROC). The ROC calculation shows the percentage difference between the current price and an earlier price. An ROC of zero, as indicated by the graph, means the price has not changed compared to 9 days ago. ROC should be above zero in an uptrend and below zero in a downtrend. However, during healthy market consolidations, the ROC can reach zero. In such cases, breaking below zero could coincide with breaking the highlighted price channel and a change in momentum.
What Is p?
Before moving on, let’s review the momentum of the S&P 500 based on the indicators and charts above. The highlighted trend channel, along with the mass and velocity indicators, suggests a market with positive momentum. Both sets of indicators are indicating some easing of momentum but not warning of an upcoming reversal. As we mentioned earlier, it’s healthy to experience brief periods of correction or consolidation in strong upward trends. So far, we should assume this is the case until our indicators and the price chart indicate otherwise.
Pitfalls of Momentum Strategies
Momentum strategies depend on the persistence of price trends and indicators that measure those trends, some of which are described above. When markets undergo significant two-way volatility or rapid rotations with market leadership shifting quickly between sectors and/or stock factors, momentum strategies often face difficulties.
The biggest problem with the strategy is its delayed reaction. Because momentum strategies rely on past price data, trends may reverse or fade before the strategy can fully take advantage of them, resulting in whipsaw losses. Additionally, the model might not detect a new momentum trend until it is well into the cycle, leaving little upside potential.
Another important factor is time. If you plan to follow a momentum strategy, you must decide whether you’re a short-term trader or a medium- or long-term investor. A short-term trader might use minute-by-minute data to capitalize on momentum trends over hours or days. Long-term traders, on the other hand, need to focus on the bigger picture. Naturally, the scope of that picture depends on how long-term an investor you are.
Mitigating Data Lag
When markets are volatile and rotations occur quickly, momentum can still be effective. Still, strategies need to adjust to the environment. For example, you may want to use shorter lookback periods to capture momentum changes more quickly.
Another practical step is diversification. Instead of depending on just one or two sectors, factors, or stocks with strong momentum, think about broadening your portfolio. This can help reduce the volatility of your returns. Additionally, including other value factors, such as market capitalization, beta, or value versus growth, alongside the momentum indicator, can result in more stable outcomes.
Summary
Momentum strategies give investors the chance for higher returns than the market. Additionally, momentum can be fairly easily measured, allowing investors to use a rule-based system, which can help reduce the influence of emotions on trading decisions.
Momentum strategies, like all other investment strategies, have periods when they perform well and periods when they underperform. For example, during periods of quick rotations where momentum trends are not sustained and volatility is high, investors can often find themselves on the wrong side of momentum.
We leave you with the graph below.
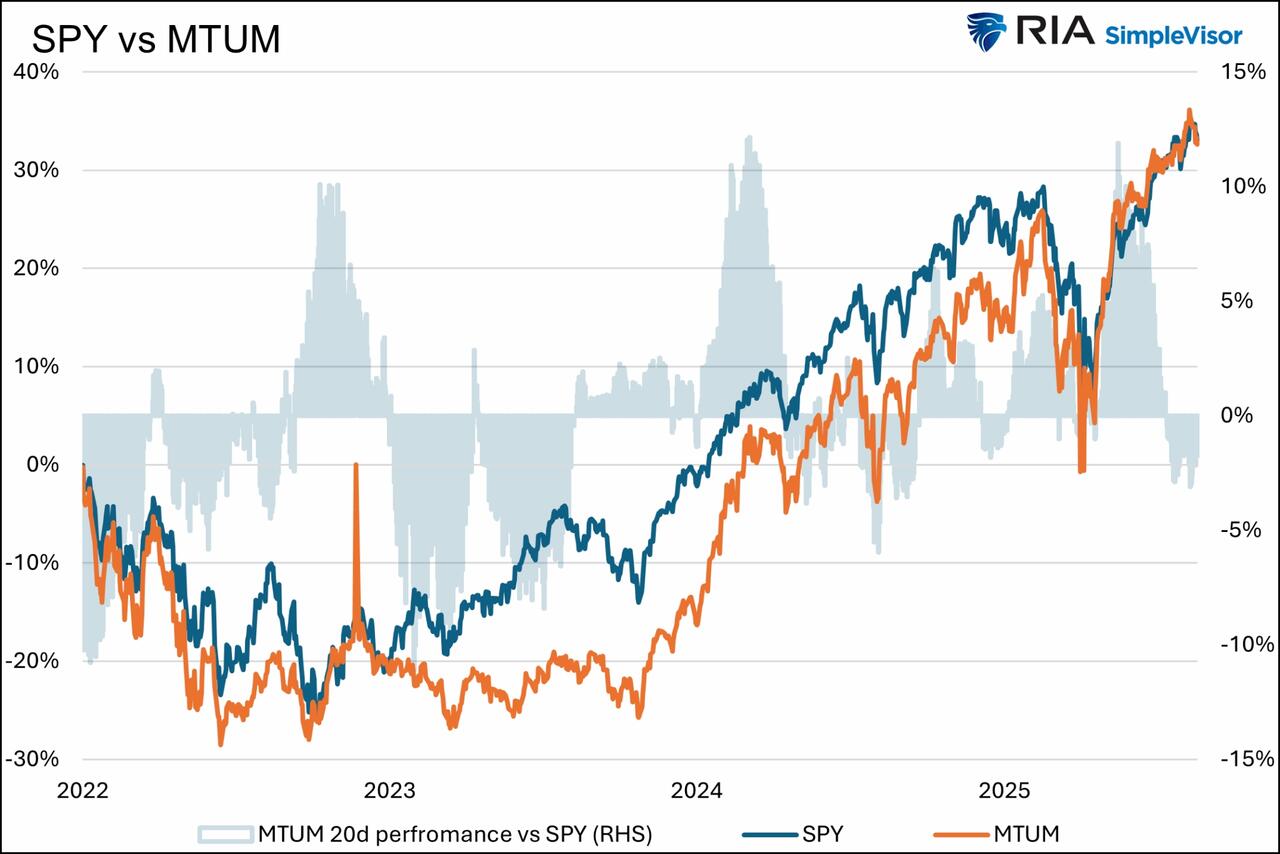 Since 2022, the performance of a widely followed momentum ETF (MTUM) has matched the S&P 500 (SPY). However, the blue shading indicates that although both ended up in the same place, the strategy experienced periods of outperformance and equally poor periods of underperformance.
Wed, 08/27/2025 - 14:25
Since 2022, the performance of a widely followed momentum ETF (MTUM) has matched the S&P 500 (SPY). However, the blue shading indicates that although both ended up in the same place, the strategy experienced periods of outperformance and equally poor periods of underperformance.
Wed, 08/27/2025 - 14:25
Momentum Strategies And Physics: Mass And Velocity Matter - RIA
In this example, we will focus on three indicators to evaluate mass.
The first indicator is volume, along with its moving average. As indicated by the red and green bars, volume has remained steady throughout the trend. This is also supported by the relatively flat moving average (black line). Ideally, we want to see rising volume alongside a trend. However, volume isn’t decreasing either, which would suggest the trend is losing momentum.
The middle graph is On Balance Volume (OBV). OBV adds volume on days when a security’s price closes higher and subtracts volume when it closes lower. Therefore, it shows a running total of buying or selling pressure. Ideally, we want to see it increasing. Like we noted with volume, which is also flat, OBV momentum isn’t gaining strength, but it doesn’t indicate that momentum is declining either.
The bottom graph shows the Volume Oscillator, which compares a shorter and a longer moving average of volume. When it declines, it indicates that volume over the shorter moving average period is less than that of the more extended period. As shown above, the oscillator has been declining, though at a slow rate.
None of the volume indicators suggest a break in the momentum trend is imminent, but they also don’t indicate the trend is gaining strength.
Velocity
Velocity (v) quantifies the persistence of the trend and its slope.
Let’s revisit the graph above with three popular indicators of velocity.
The graph shows the Moving Average Convergence Divergence, or MACD. The MACD is computed by subtracting a longer-term moving average from a shorter-term one. Additionally, a signal line, an even shorter moving average, accompanies the MACD. We examine not only the trend and level of the MACD but also convergences or divergences from the signal line. A convergence indicates a weakening trend, while divergence suggests increasing momentum. In the graph, the MACD remains stable with no apparent signs of convergence or divergence. Although generally bullish, the MACD level is high, which is difficult to sustain, and it has been gradually sloping downward.
The indicator just below the price chart is the Relative Price Index, or RSI. The RSI is an oscillator that measures the speed and magnitude of price movements. The index ranges from 100, which signals it’s very overbought, to 0, indicating it is very oversold. Typically, levels above 75 and below 25 suggest a reversal in momentum is likely. Equally important is the trend of the RSI line. Like most indicators, we prefer a gently rising or falling trend over sharp movements. Currently, after reaching overbought levels in late July, the RSI has generally been declining, showing that momentum is weakening.
Last is the Rate of Change (ROC). The ROC calculation shows the percentage difference between the current price and an earlier price. An ROC of zero, as indicated by the graph, means the price has not changed compared to 9 days ago. ROC should be above zero in an uptrend and below zero in a downtrend. However, during healthy market consolidations, the ROC can reach zero. In such cases, breaking below zero could coincide with breaking the highlighted price channel and a change in momentum.
What Is p?
Before moving on, let’s review the momentum of the S&P 500 based on the indicators and charts above. The highlighted trend channel, along with the mass and velocity indicators, suggests a market with positive momentum. Both sets of indicators are indicating some easing of momentum but not warning of an upcoming reversal. As we mentioned earlier, it’s healthy to experience brief periods of correction or consolidation in strong upward trends. So far, we should assume this is the case until our indicators and the price chart indicate otherwise.
Pitfalls of Momentum Strategies
Momentum strategies depend on the persistence of price trends and indicators that measure those trends, some of which are described above. When markets undergo significant two-way volatility or rapid rotations with market leadership shifting quickly between sectors and/or stock factors, momentum strategies often face difficulties.
The biggest problem with the strategy is its delayed reaction. Because momentum strategies rely on past price data, trends may reverse or fade before the strategy can fully take advantage of them, resulting in whipsaw losses. Additionally, the model might not detect a new momentum trend until it is well into the cycle, leaving little upside potential.
Another important factor is time. If you plan to follow a momentum strategy, you must decide whether you’re a short-term trader or a medium- or long-term investor. A short-term trader might use minute-by-minute data to capitalize on momentum trends over hours or days. Long-term traders, on the other hand, need to focus on the bigger picture. Naturally, the scope of that picture depends on how long-term an investor you are.
Mitigating Data Lag
When markets are volatile and rotations occur quickly, momentum can still be effective. Still, strategies need to adjust to the environment. For example, you may want to use shorter lookback periods to capture momentum changes more quickly.
Another practical step is diversification. Instead of depending on just one or two sectors, factors, or stocks with strong momentum, think about broadening your portfolio. This can help reduce the volatility of your returns. Additionally, including other value factors, such as market capitalization, beta, or value versus growth, alongside the momentum indicator, can result in more stable outcomes.
Summary
Momentum strategies give investors the chance for higher returns than the market. Additionally, momentum can be fairly easily measured, allowing investors to use a rule-based system, which can help reduce the influence of emotions on trading decisions.
Momentum strategies, like all other investment strategies, have periods when they perform well and periods when they underperform. For example, during periods of quick rotations where momentum trends are not sustained and volatility is high, investors can often find themselves on the wrong side of momentum.
We leave you with the graph below.
Since 2022, the performance of a widely followed momentum ETF (MTUM) has matched the S&P 500 (SPY). However, the blue shading indicates that although both ended up in the same place, the strategy experienced periods of outperformance and equally poor periods of underperformance.
Tyler Durden | Zero Hedge
Zero Hedge
Momentum Strategies And Physics: Mass And Velocity Matter | ZeroHedge
ZeroHedge - On a long enough timeline, the survival rate for everyone drops to zero


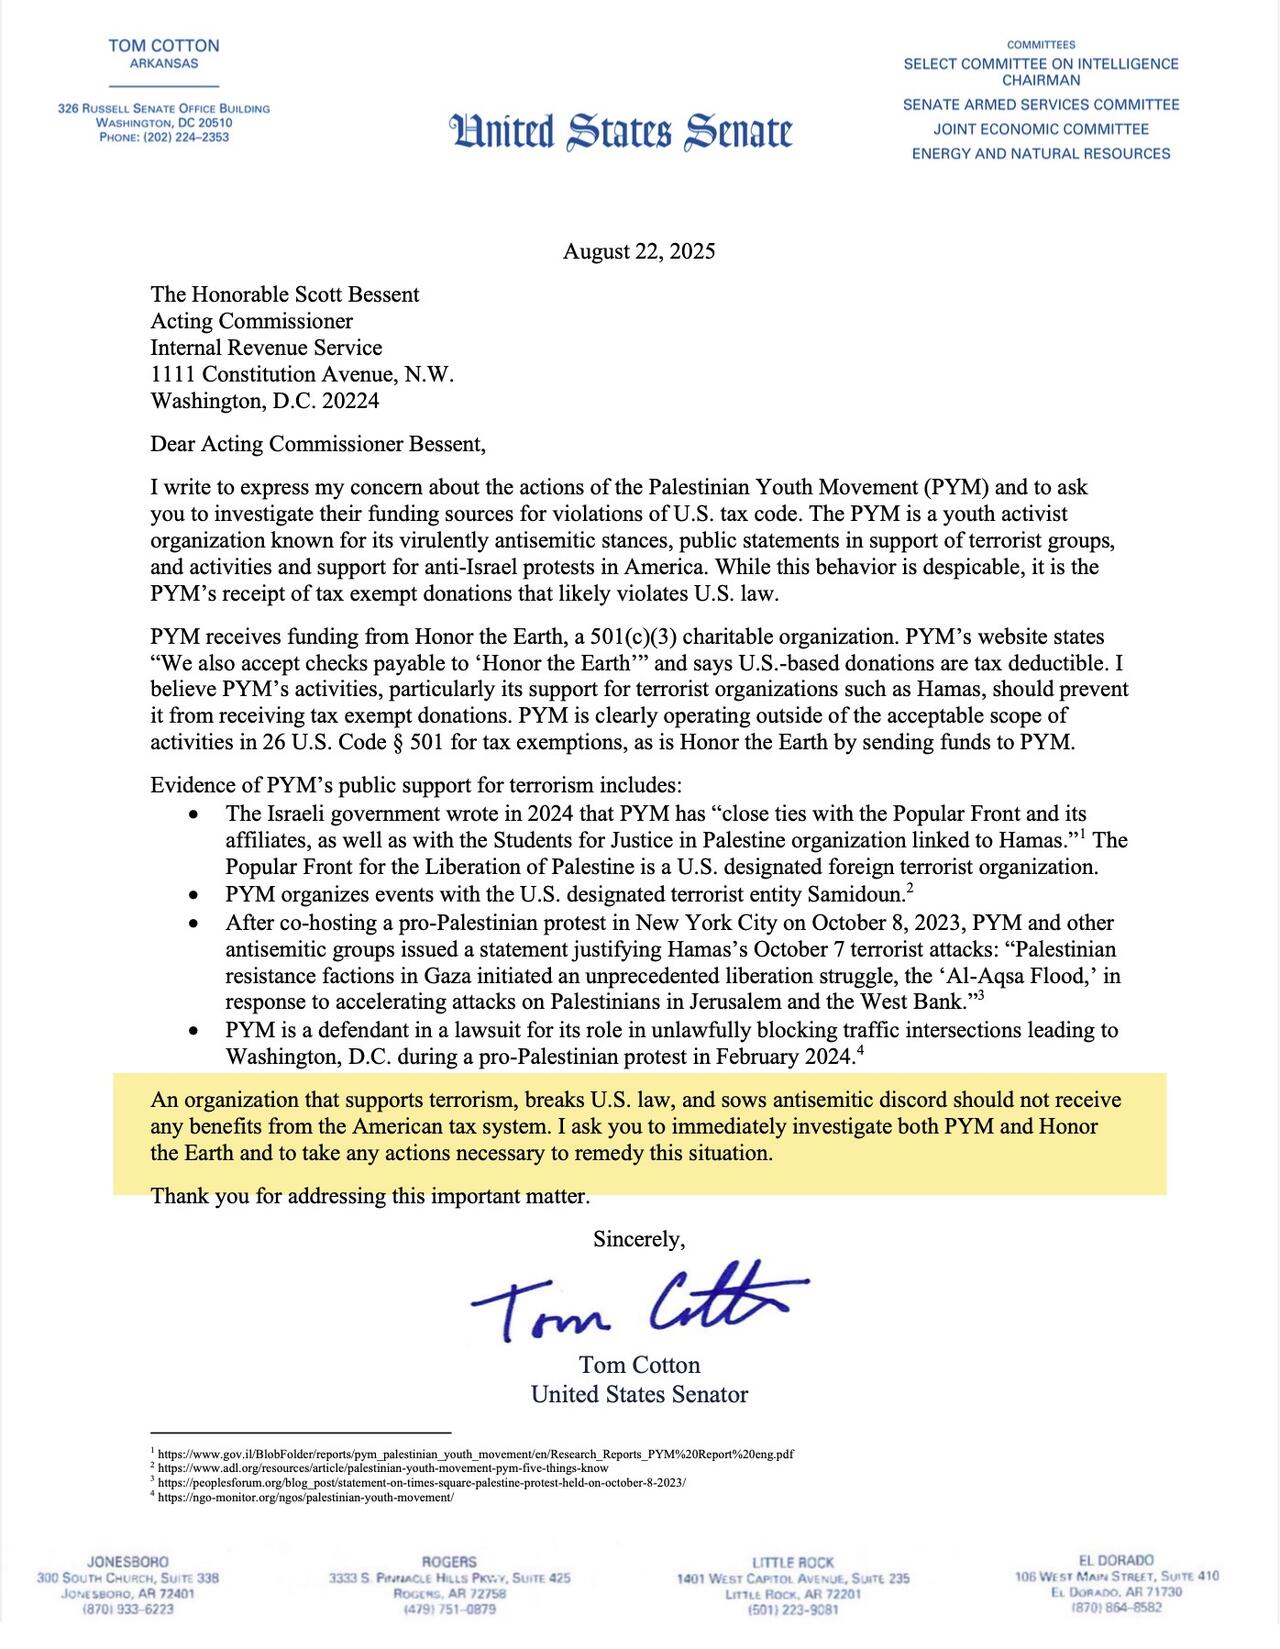 "An organization that supports terrorism, breaks U.S. law, and sows antisemitic discord should not receive any benefits from the American tax system. I ask you to immediately investigate both PYM and Honor the Earth and to take any actions necessary to remedy this situation," Cotton wrote in the letter.
Commentary on PYM via
"An organization that supports terrorism, breaks U.S. law, and sows antisemitic discord should not receive any benefits from the American tax system. I ask you to immediately investigate both PYM and Honor the Earth and to take any actions necessary to remedy this situation," Cotton wrote in the letter.
Commentary on PYM via 
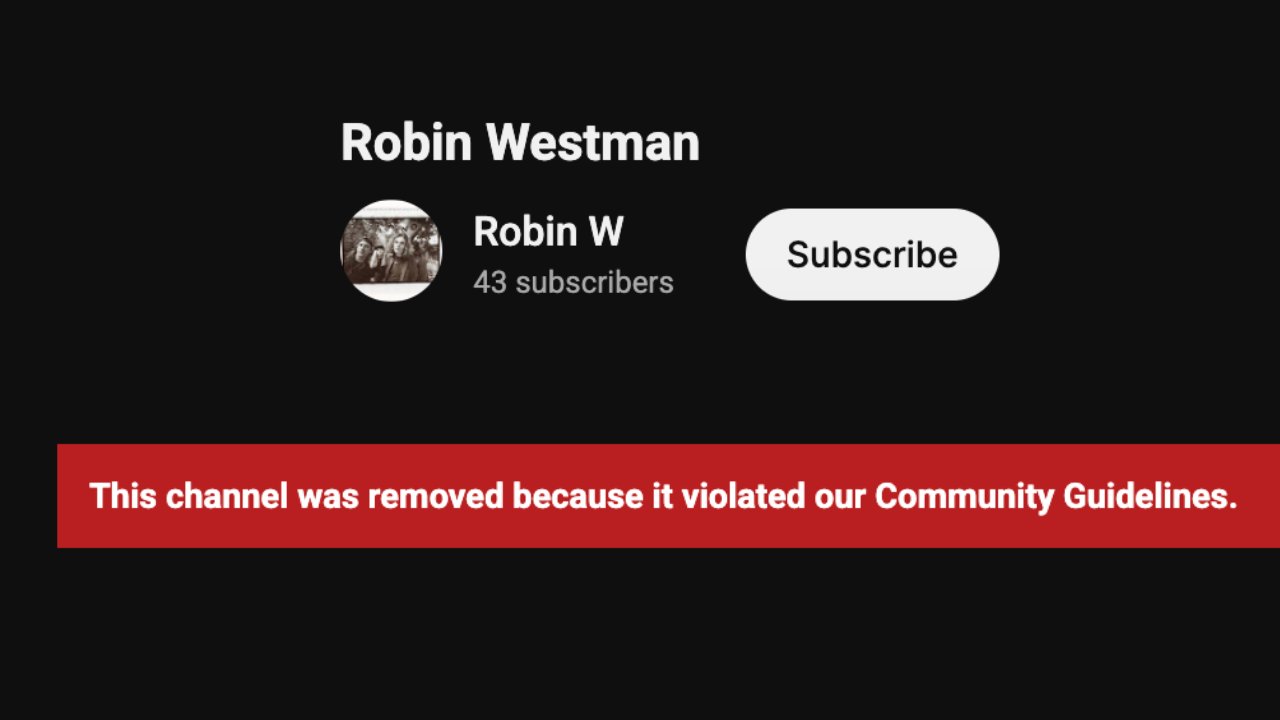
 According to NYPost, Westman maintained a YouTube account that featured a video displaying multiple weapons.
One screenshot from the video showed a semi-automatic rifle and a shotgun, with text on one magazine reading "kill Donald Trump."
According to NYPost, Westman maintained a YouTube account that featured a video displaying multiple weapons.
One screenshot from the video showed a semi-automatic rifle and a shotgun, with text on one magazine reading "kill Donald Trump."
 Benny Johnson confirmed: "Minneapolis Catholic church shooter Robin Westman was a transgender who "identified as a woman" and legally changed his name from "Robert" in 2020."
🚨CONFIRMED: Minneapolis Catholic church shooter Robin Westman was a transgender who “identified as a woman” and legally changed his name from “Robert” in 2020.
Benny Johnson confirmed: "Minneapolis Catholic church shooter Robin Westman was a transgender who "identified as a woman" and legally changed his name from "Robert" in 2020."
🚨CONFIRMED: Minneapolis Catholic church shooter Robin Westman was a transgender who “identified as a woman” and legally changed his name from “Robert” in 2020. 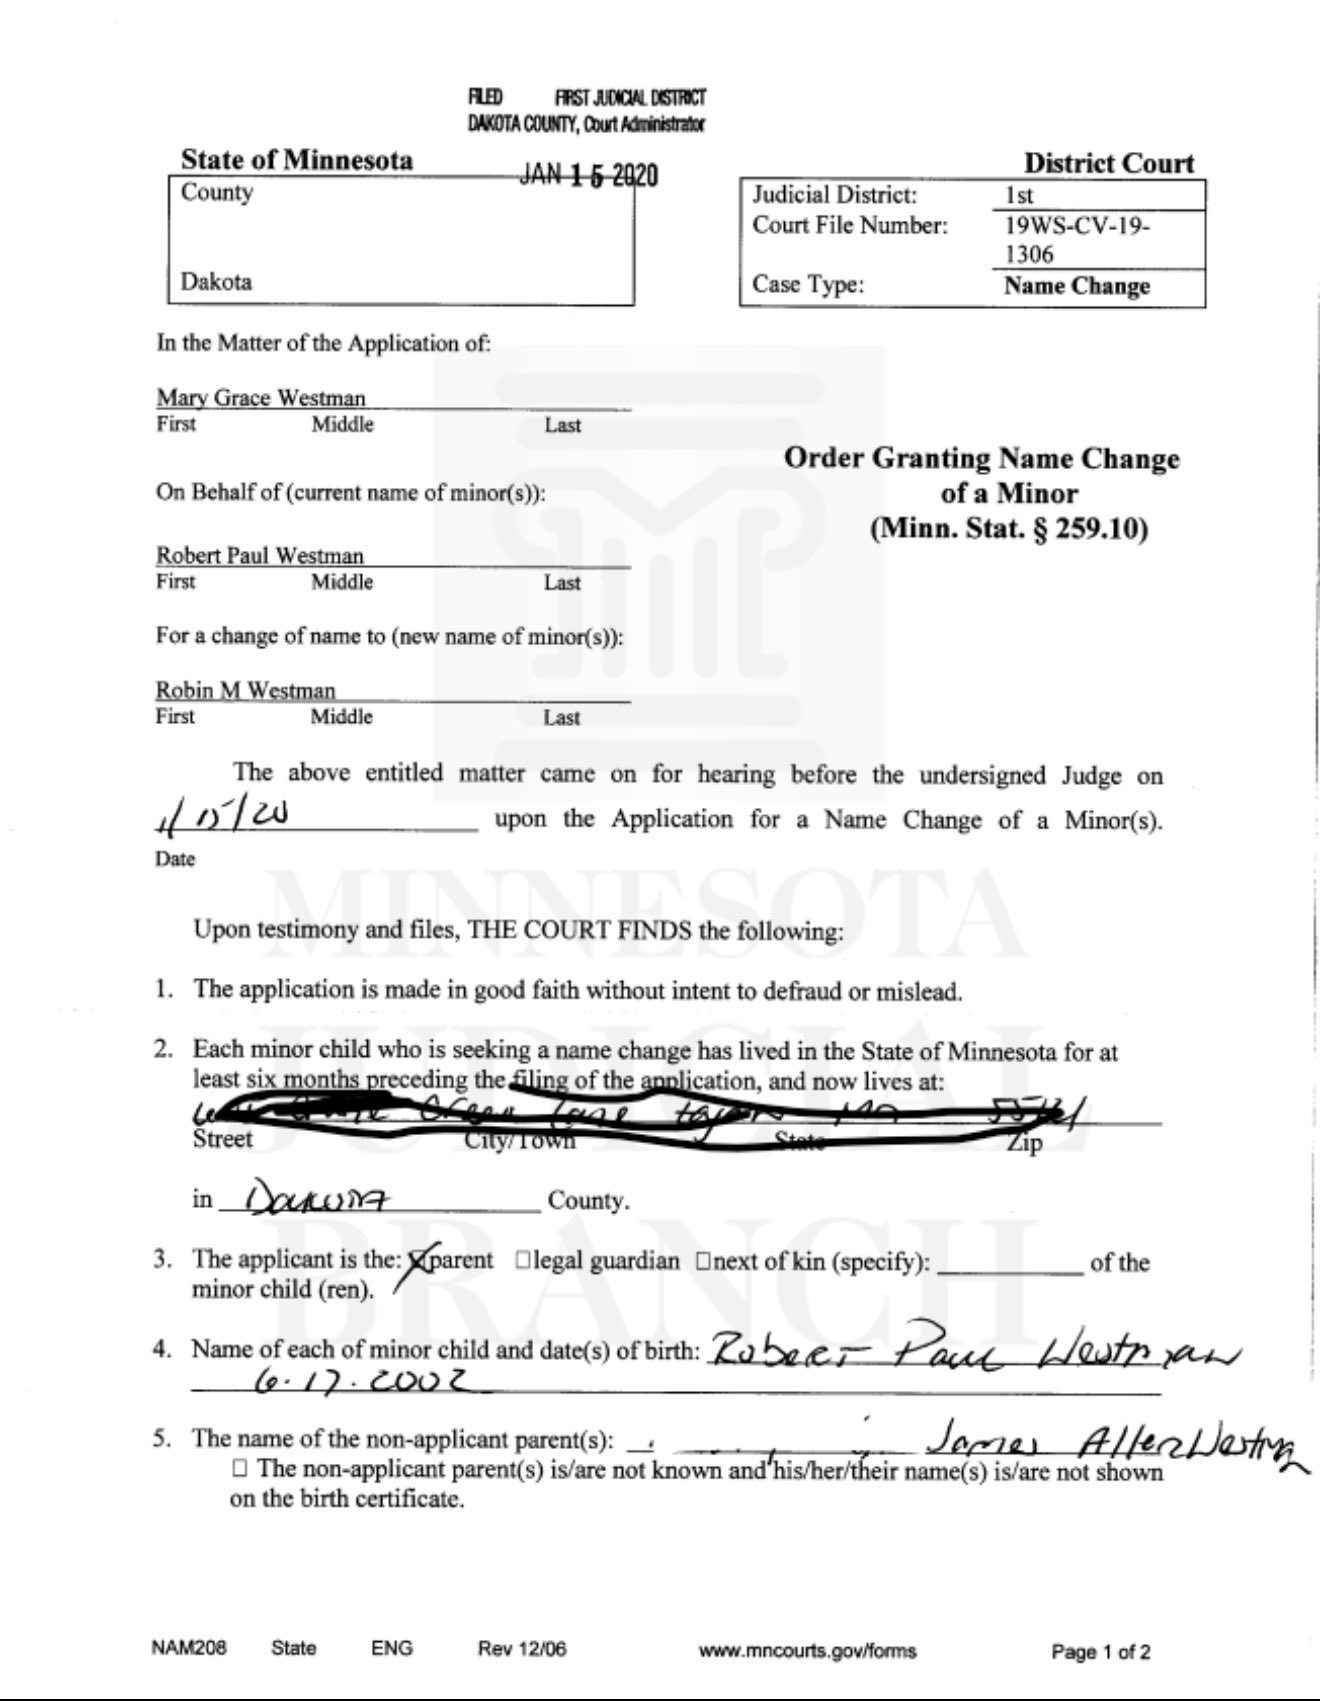

 Early reports indicate that at least two people were killed and several others wounded.
NEW: Crime in Minneapolis was so bad last night that the police response to the Annunciation Catholic School may have been limited, according to Fox.
As many as 20 people were injured. There was an "All-School Mass" scheduled this morning, according to NBC News.
Horrific.
Early reports indicate that at least two people were killed and several others wounded.
NEW: Crime in Minneapolis was so bad last night that the police response to the Annunciation Catholic School may have been limited, according to Fox.
As many as 20 people were injured. There was an "All-School Mass" scheduled this morning, according to NBC News.
Horrific. 
 The city of Minneapolis posted on X that the "shooter is contained" and "no active threat to the community at this time."
 The city asked people to stay away from the area "to allow emergency personnel to help victims."
*SHOOTER AT MINNEAPOLIS CHURCH 'CONTAINED,' CITY SAYS IN X POST
— zerohedge (@zerohedge)
The city asked people to stay away from the area "to allow emergency personnel to help victims."
*SHOOTER AT MINNEAPOLIS CHURCH 'CONTAINED,' CITY SAYS IN X POST
— zerohedge (@zerohedge) 


 Minneapolis Mayor Jacob Frey and law enforcement will hold a press conference at 11:30 a.m. ET.
NBC reports that before today's school shooting, there were three deadly shootings in Minneapolis in 12 hours.
"The level of gun violence across the city within the last day is deeply unsettling," the Minneapolis Police Department stated earlier, adding, "Across three separate multiple-victim shootings, eight people have been injured by gunfire and three have lost their lives."
The attack at Annunciation Church would be the fourth deadly shooting in less than one day.
2 days ago, Minnesota Governor Tim Walz attacked the National Guard deployments to stop crime
Today, a school full of Catholic children was shot up in his state
Minneapolis Mayor Jacob Frey and law enforcement will hold a press conference at 11:30 a.m. ET.
NBC reports that before today's school shooting, there were three deadly shootings in Minneapolis in 12 hours.
"The level of gun violence across the city within the last day is deeply unsettling," the Minneapolis Police Department stated earlier, adding, "Across three separate multiple-victim shootings, eight people have been injured by gunfire and three have lost their lives."
The attack at Annunciation Church would be the fourth deadly shooting in less than one day.
2 days ago, Minnesota Governor Tim Walz attacked the National Guard deployments to stop crime
Today, a school full of Catholic children was shot up in his state 

 “We talk to the Russians every day,” he added, saying he believed Russian President Vladimir Putin wished to bring the war to a close.
“I think he [Putin] has made a good faith effort to engage. He certainly did at the Alaska summit. But it’s a very complicated conflict.
“I think that we may end up seeing a bilateral meeting. My own opinion is that the president is going to be needed at the table to finish a deal.”
U.S. President Donald Trump met with Putin in
“We talk to the Russians every day,” he added, saying he believed Russian President Vladimir Putin wished to bring the war to a close.
“I think he [Putin] has made a good faith effort to engage. He certainly did at the Alaska summit. But it’s a very complicated conflict.
“I think that we may end up seeing a bilateral meeting. My own opinion is that the president is going to be needed at the table to finish a deal.”
U.S. President Donald Trump met with Putin in 


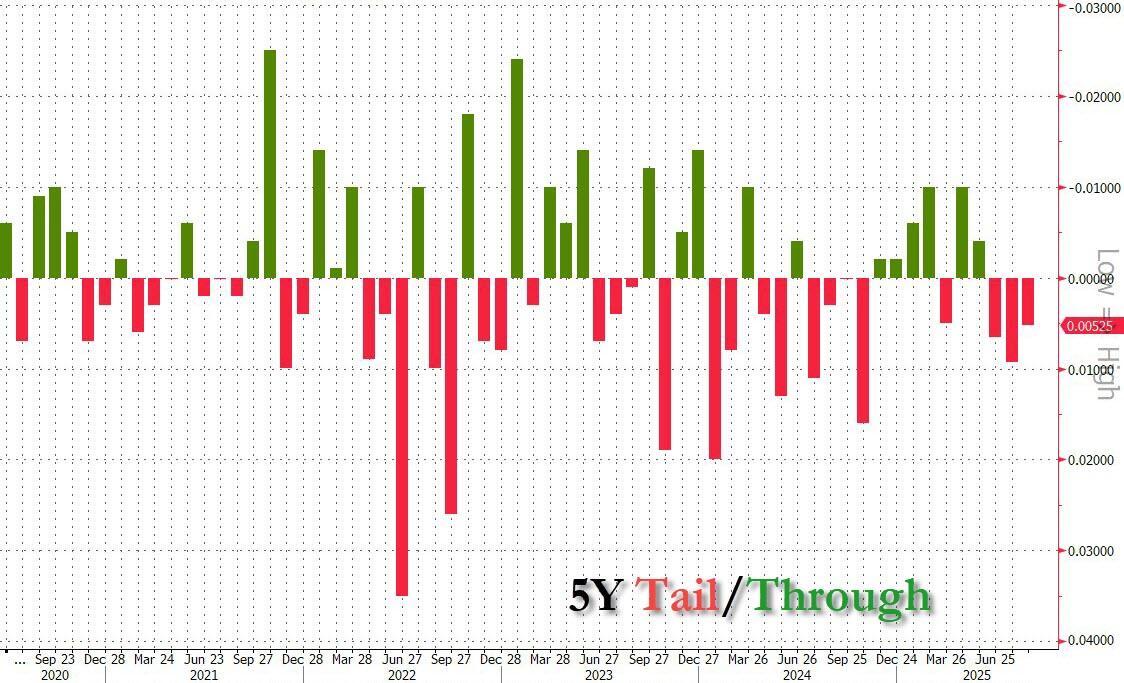 The Bid to Cover was 2.36, up from last month's ugly 2.31, but below the six auction average of 2.37.
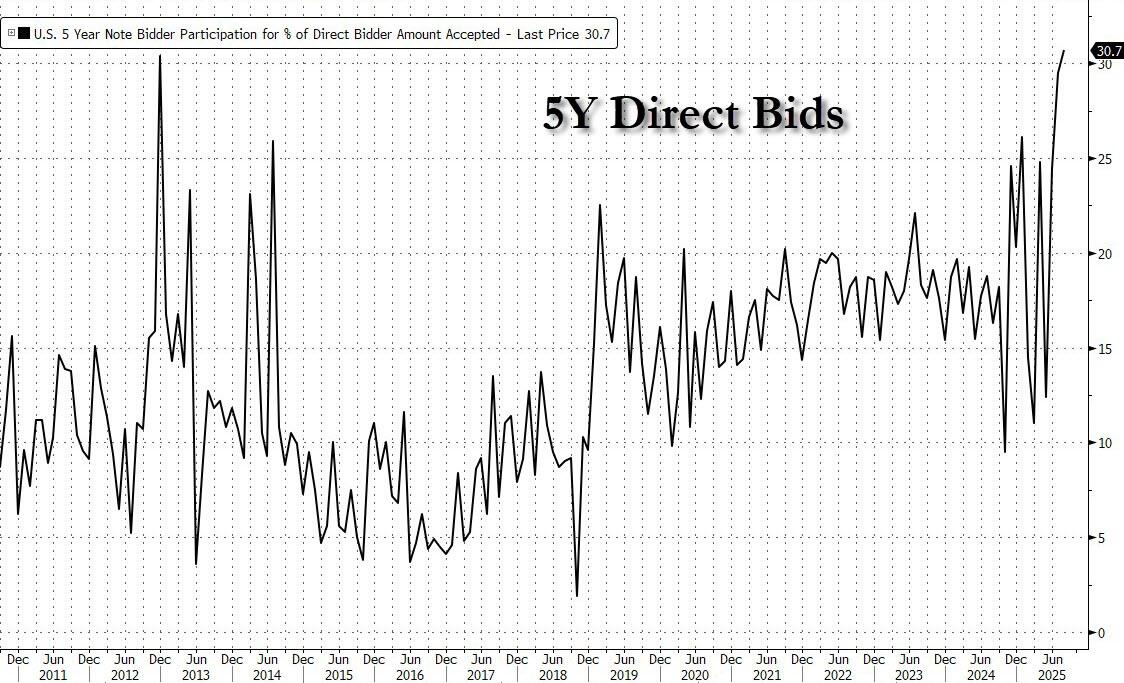
The internals were also wobbly, with Indirects taking 60.5%, up from 58.3%, but also far below the recent average of 69.3%. But weakness in foreign demand was offset by a surge in domestic demand, with Directs taking a new record high of 30.7%.
The Bid to Cover was 2.36, up from last month's ugly 2.31, but below the six auction average of 2.37.
The internals were also wobbly, with Indirects taking 60.5%, up from 58.3%, but also far below the recent average of 69.3%. But weakness in foreign demand was offset by a surge in domestic demand, with Directs taking a new record high of 30.7%.
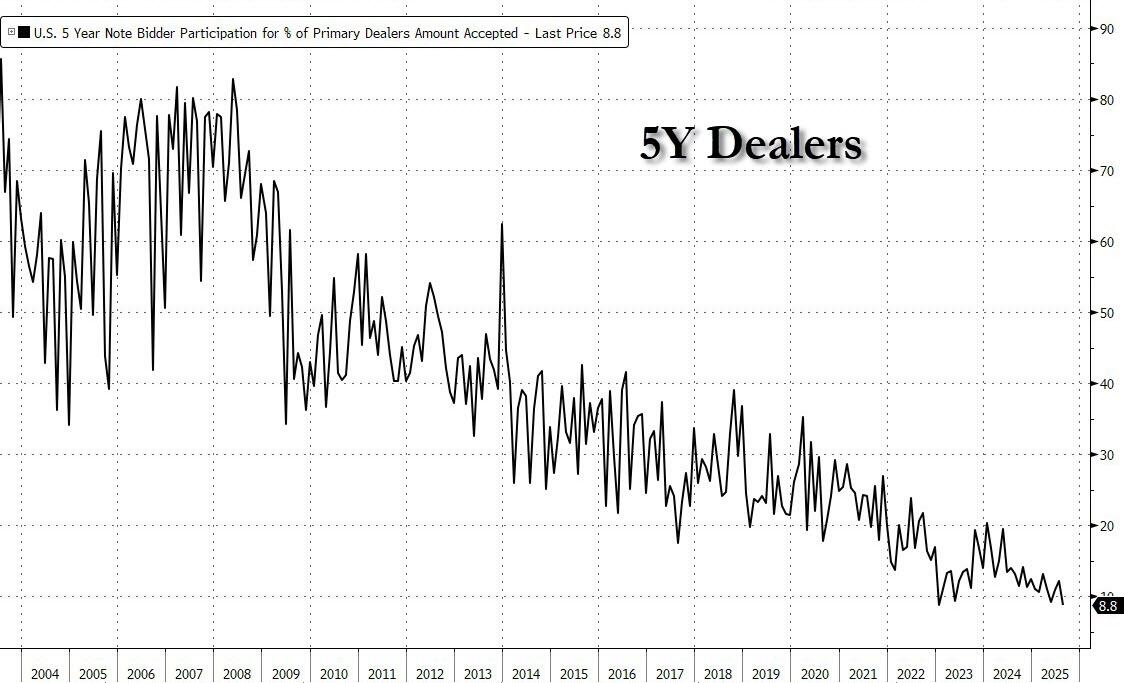
 This left just 8.8% for Dealers, tied with the previous record low from Jan 2023.
 And overall:
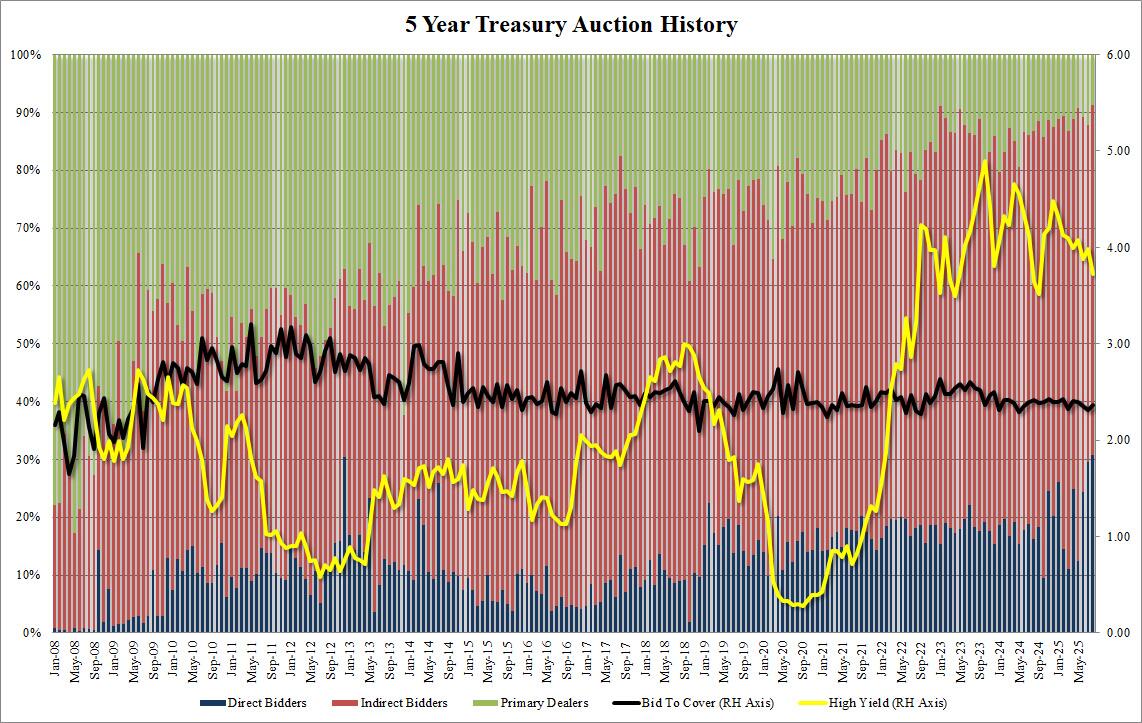 While this was generally a disappointing auction, although with some silver linings below the surface, clearly the market did not care, and 10Y yields slumped to the day's lows shortly after the auction.
 As my colleagues pointed out in this daily over the past couple of days, the president is trying to align the central bank with his broader agenda. So why stop here?
If the dismissal of Cook holds up in court, Trump-appointees will have a majority in the Fed’s Board of Governors. But the Federal Open Market Committee, which makes policy decisions, also consists of the presidents of the 12 regional Federal Reserve banks. The next headline should therefore not be surprising. Bloomberg
As my colleagues pointed out in this daily over the past couple of days, the president is trying to align the central bank with his broader agenda. So why stop here?
If the dismissal of Cook holds up in court, Trump-appointees will have a majority in the Fed’s Board of Governors. But the Federal Open Market Committee, which makes policy decisions, also consists of the presidents of the 12 regional Federal Reserve banks. The next headline should therefore not be surprising. Bloomberg 
 From small family stores to large retail chains, shops across the country now accept crypto through platforms such as Binance and Airtm. Some businesses even use stablecoins to pay employees, while universities have begun offering courses dedicated to digital assets.
“There’s lots of places accepting it now,” shopper Victor Sousa, who paid for phone accessories with USDt,
From small family stores to large retail chains, shops across the country now accept crypto through platforms such as Binance and Airtm. Some businesses even use stablecoins to pay employees, while universities have begun offering courses dedicated to digital assets.
“There’s lots of places accepting it now,” shopper Victor Sousa, who paid for phone accessories with USDt, 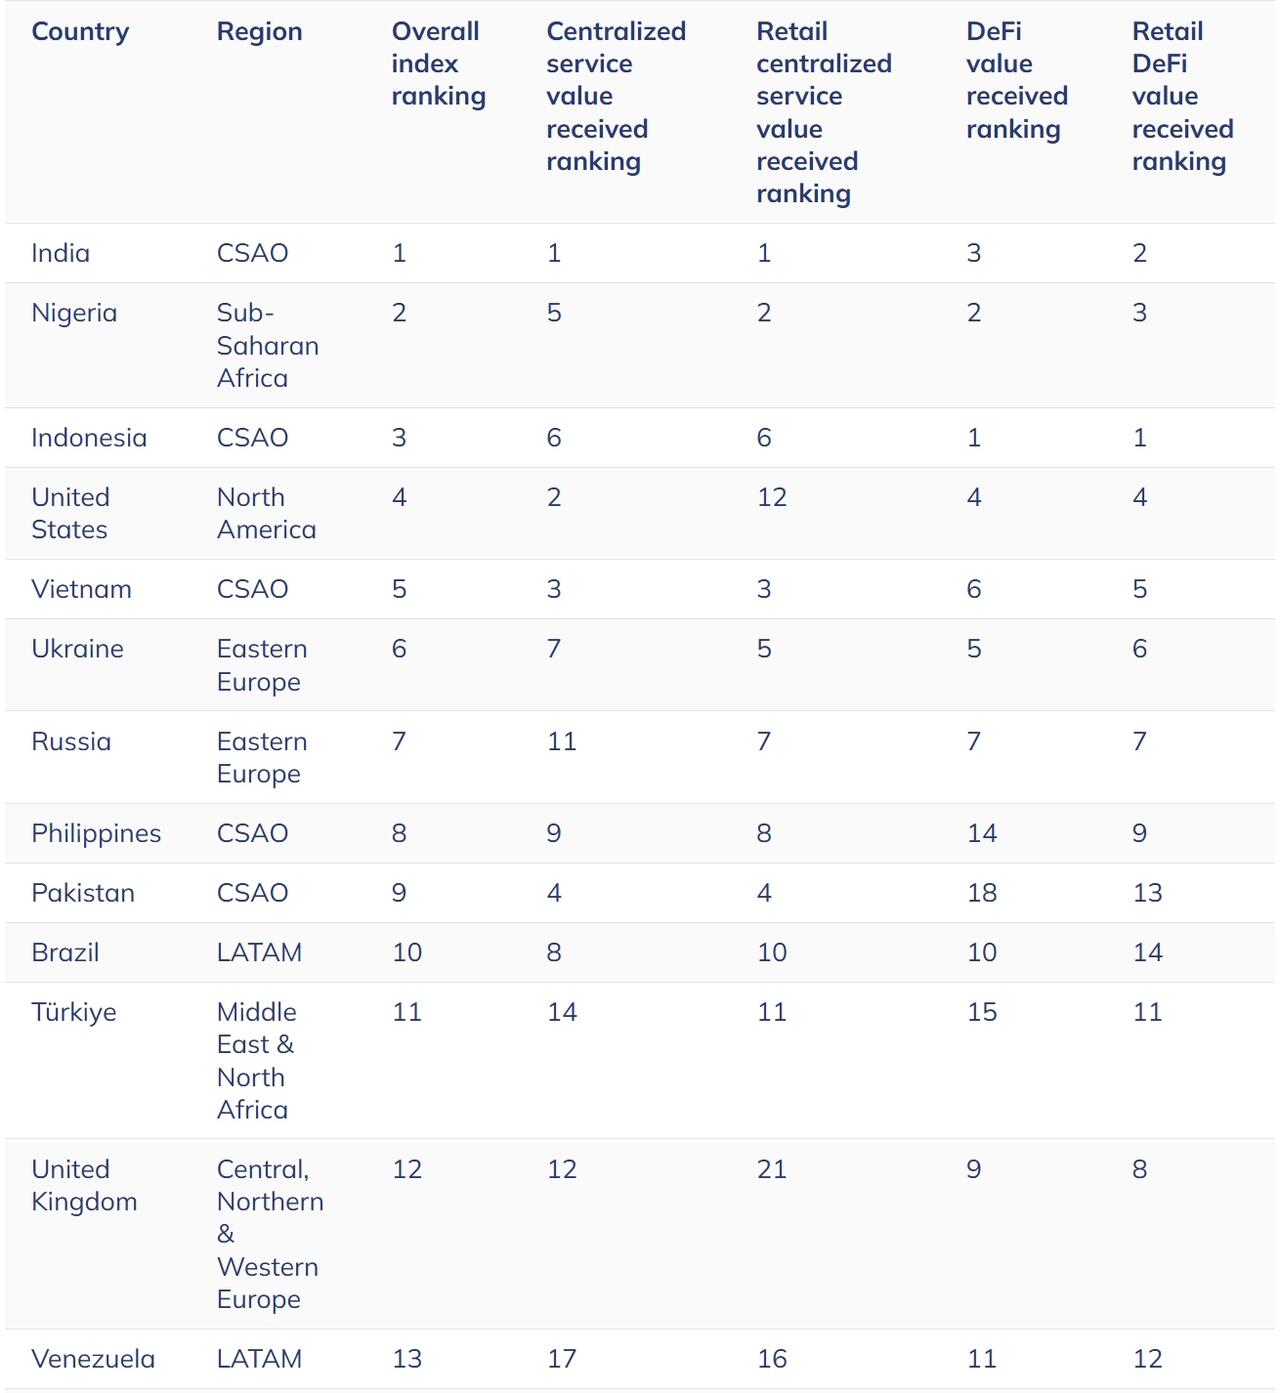 Venezuela ranked 13th globally for crypto adoption. Source: Chainalysis
Bolívar’s crash pushes Venezuelans into crypto
The continued slide of the bolívar currency has intensified demand for crypto. Since the government stopped defending the currency in October, it has lost more than 70% of its value. Inflation reached 229% in May, according to the Venezuelan Finance Observatory (OVF).
“Venezuelans started using cryptocurrencies out of necessity,” said economist Aarón Olmos. He noted that they face inflation, low wages, foreign currency shortages and difficulty opening bank accounts.
However, access is not always smooth. With US sanctions on Venezuela’s financial sector, Binance restricts services linked to sanctioned banks and individuals. Connectivity issues also hinder widespread use. Still, experts say the ecosystem is resilient, per the FT report.
The government’s stance on crypto remains inconsistent. Venezuela
Venezuela ranked 13th globally for crypto adoption. Source: Chainalysis
Bolívar’s crash pushes Venezuelans into crypto
The continued slide of the bolívar currency has intensified demand for crypto. Since the government stopped defending the currency in October, it has lost more than 70% of its value. Inflation reached 229% in May, according to the Venezuelan Finance Observatory (OVF).
“Venezuelans started using cryptocurrencies out of necessity,” said economist Aarón Olmos. He noted that they face inflation, low wages, foreign currency shortages and difficulty opening bank accounts.
However, access is not always smooth. With US sanctions on Venezuela’s financial sector, Binance restricts services linked to sanctioned banks and individuals. Connectivity issues also hinder widespread use. Still, experts say the ecosystem is resilient, per the FT report.
The government’s stance on crypto remains inconsistent. Venezuela 


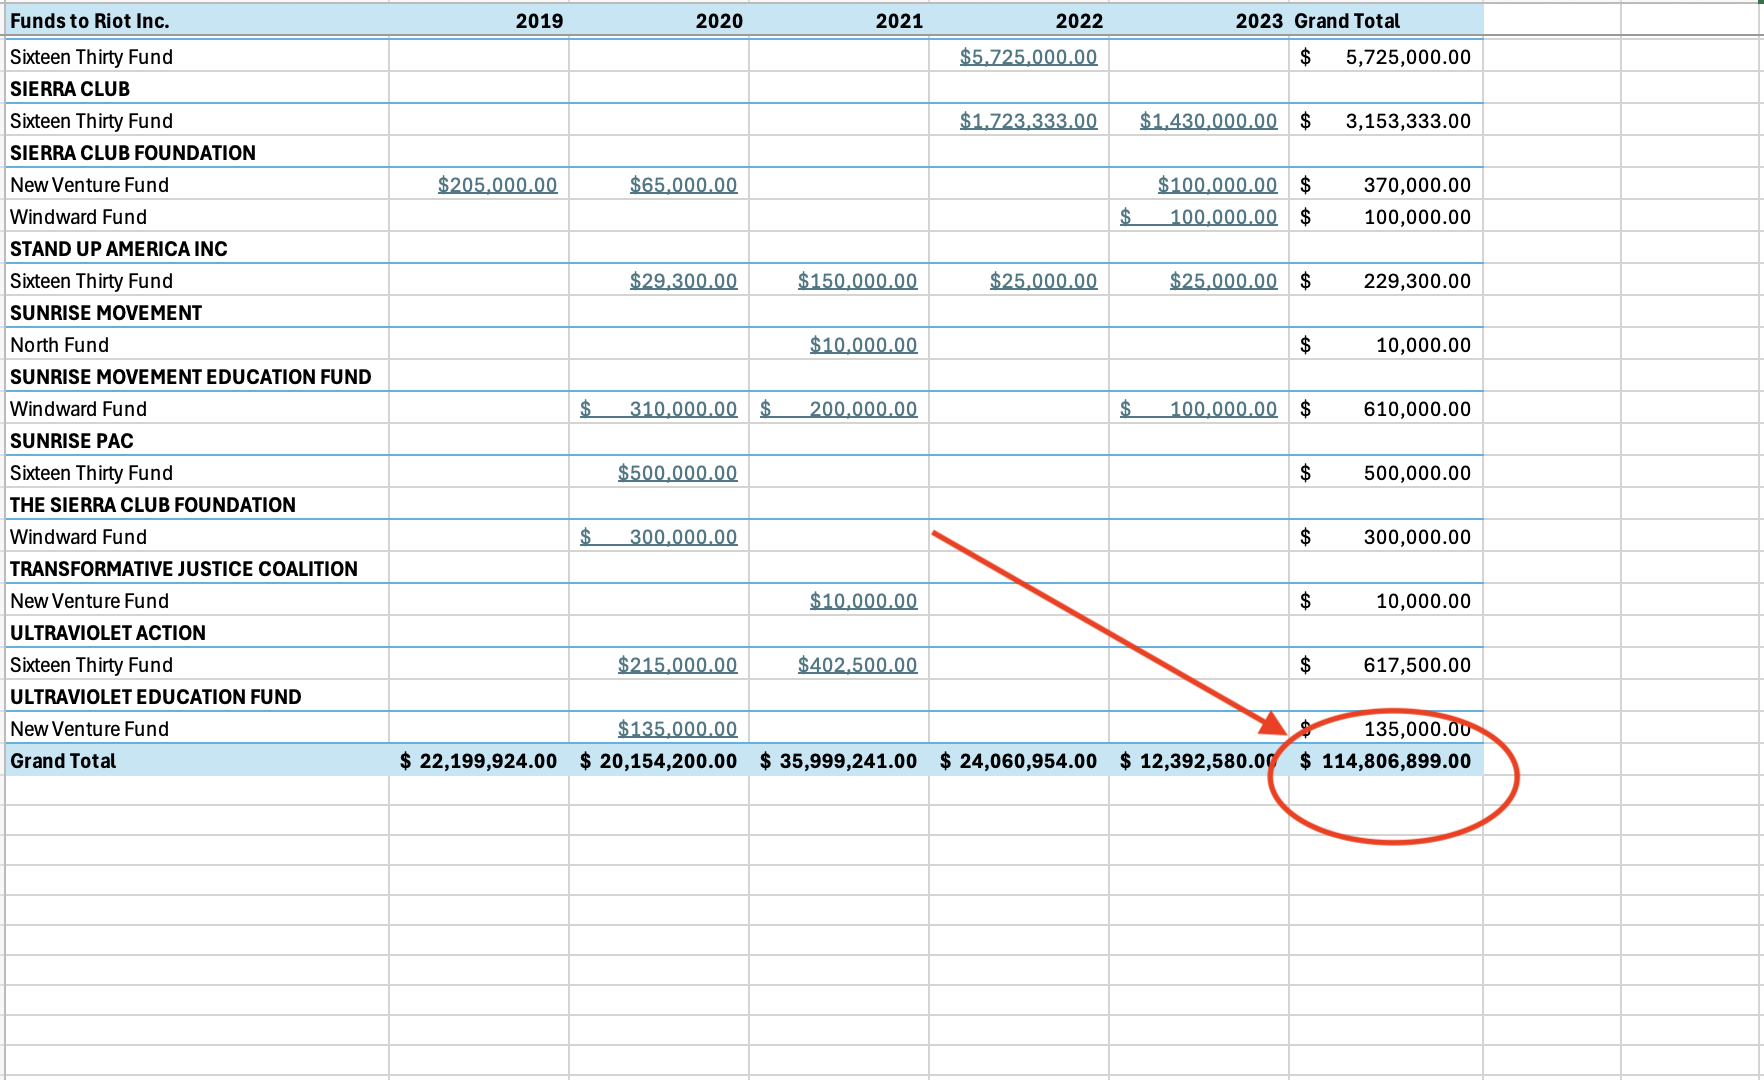
 The Gates Foundation has funneled more than $200 million to the Arabella network funds since, according to the most recent financial disclosures.
 Visualize:
 Summary of Gates Foundation to Arabella empire, then distributed...
 * * *
The "dark money" network operated by Arabella Advisors has reportedly lost one of its top funding sources: a leftist billionaire's foundation.
* * *
The "dark money" network operated by Arabella Advisors has reportedly lost one of its top funding sources: a leftist billionaire's foundation.
 Equally significant in the news cycle this morning, President Trump stated on Truth Social that George Soros and his radical leftist son, Alex Soros, "should be charged with RICO because of their support of violent protests."
Trump: "George Soros, and his wonderful Radical Left son, should be charged with RICO because of their support of Violent Protests, and much more, all throughout the United States of America."
Equally significant in the news cycle this morning, President Trump stated on Truth Social that George Soros and his radical leftist son, Alex Soros, "should be charged with RICO because of their support of violent protests."
Trump: "George Soros, and his wonderful Radical Left son, should be charged with RICO because of their support of Violent Protests, and much more, all throughout the United States of America." 


 Even though other DOGE teams at various federal agencies have already been wound down or have completed their missions, cutting waste and fraud in the Department of Defense is paramount to overhauling that agency, which commands an annual budget of $850 billion.
New details from
Even though other DOGE teams at various federal agencies have already been wound down or have completed their missions, cutting waste and fraud in the Department of Defense is paramount to overhauling that agency, which commands an annual budget of $850 billion.
New details from