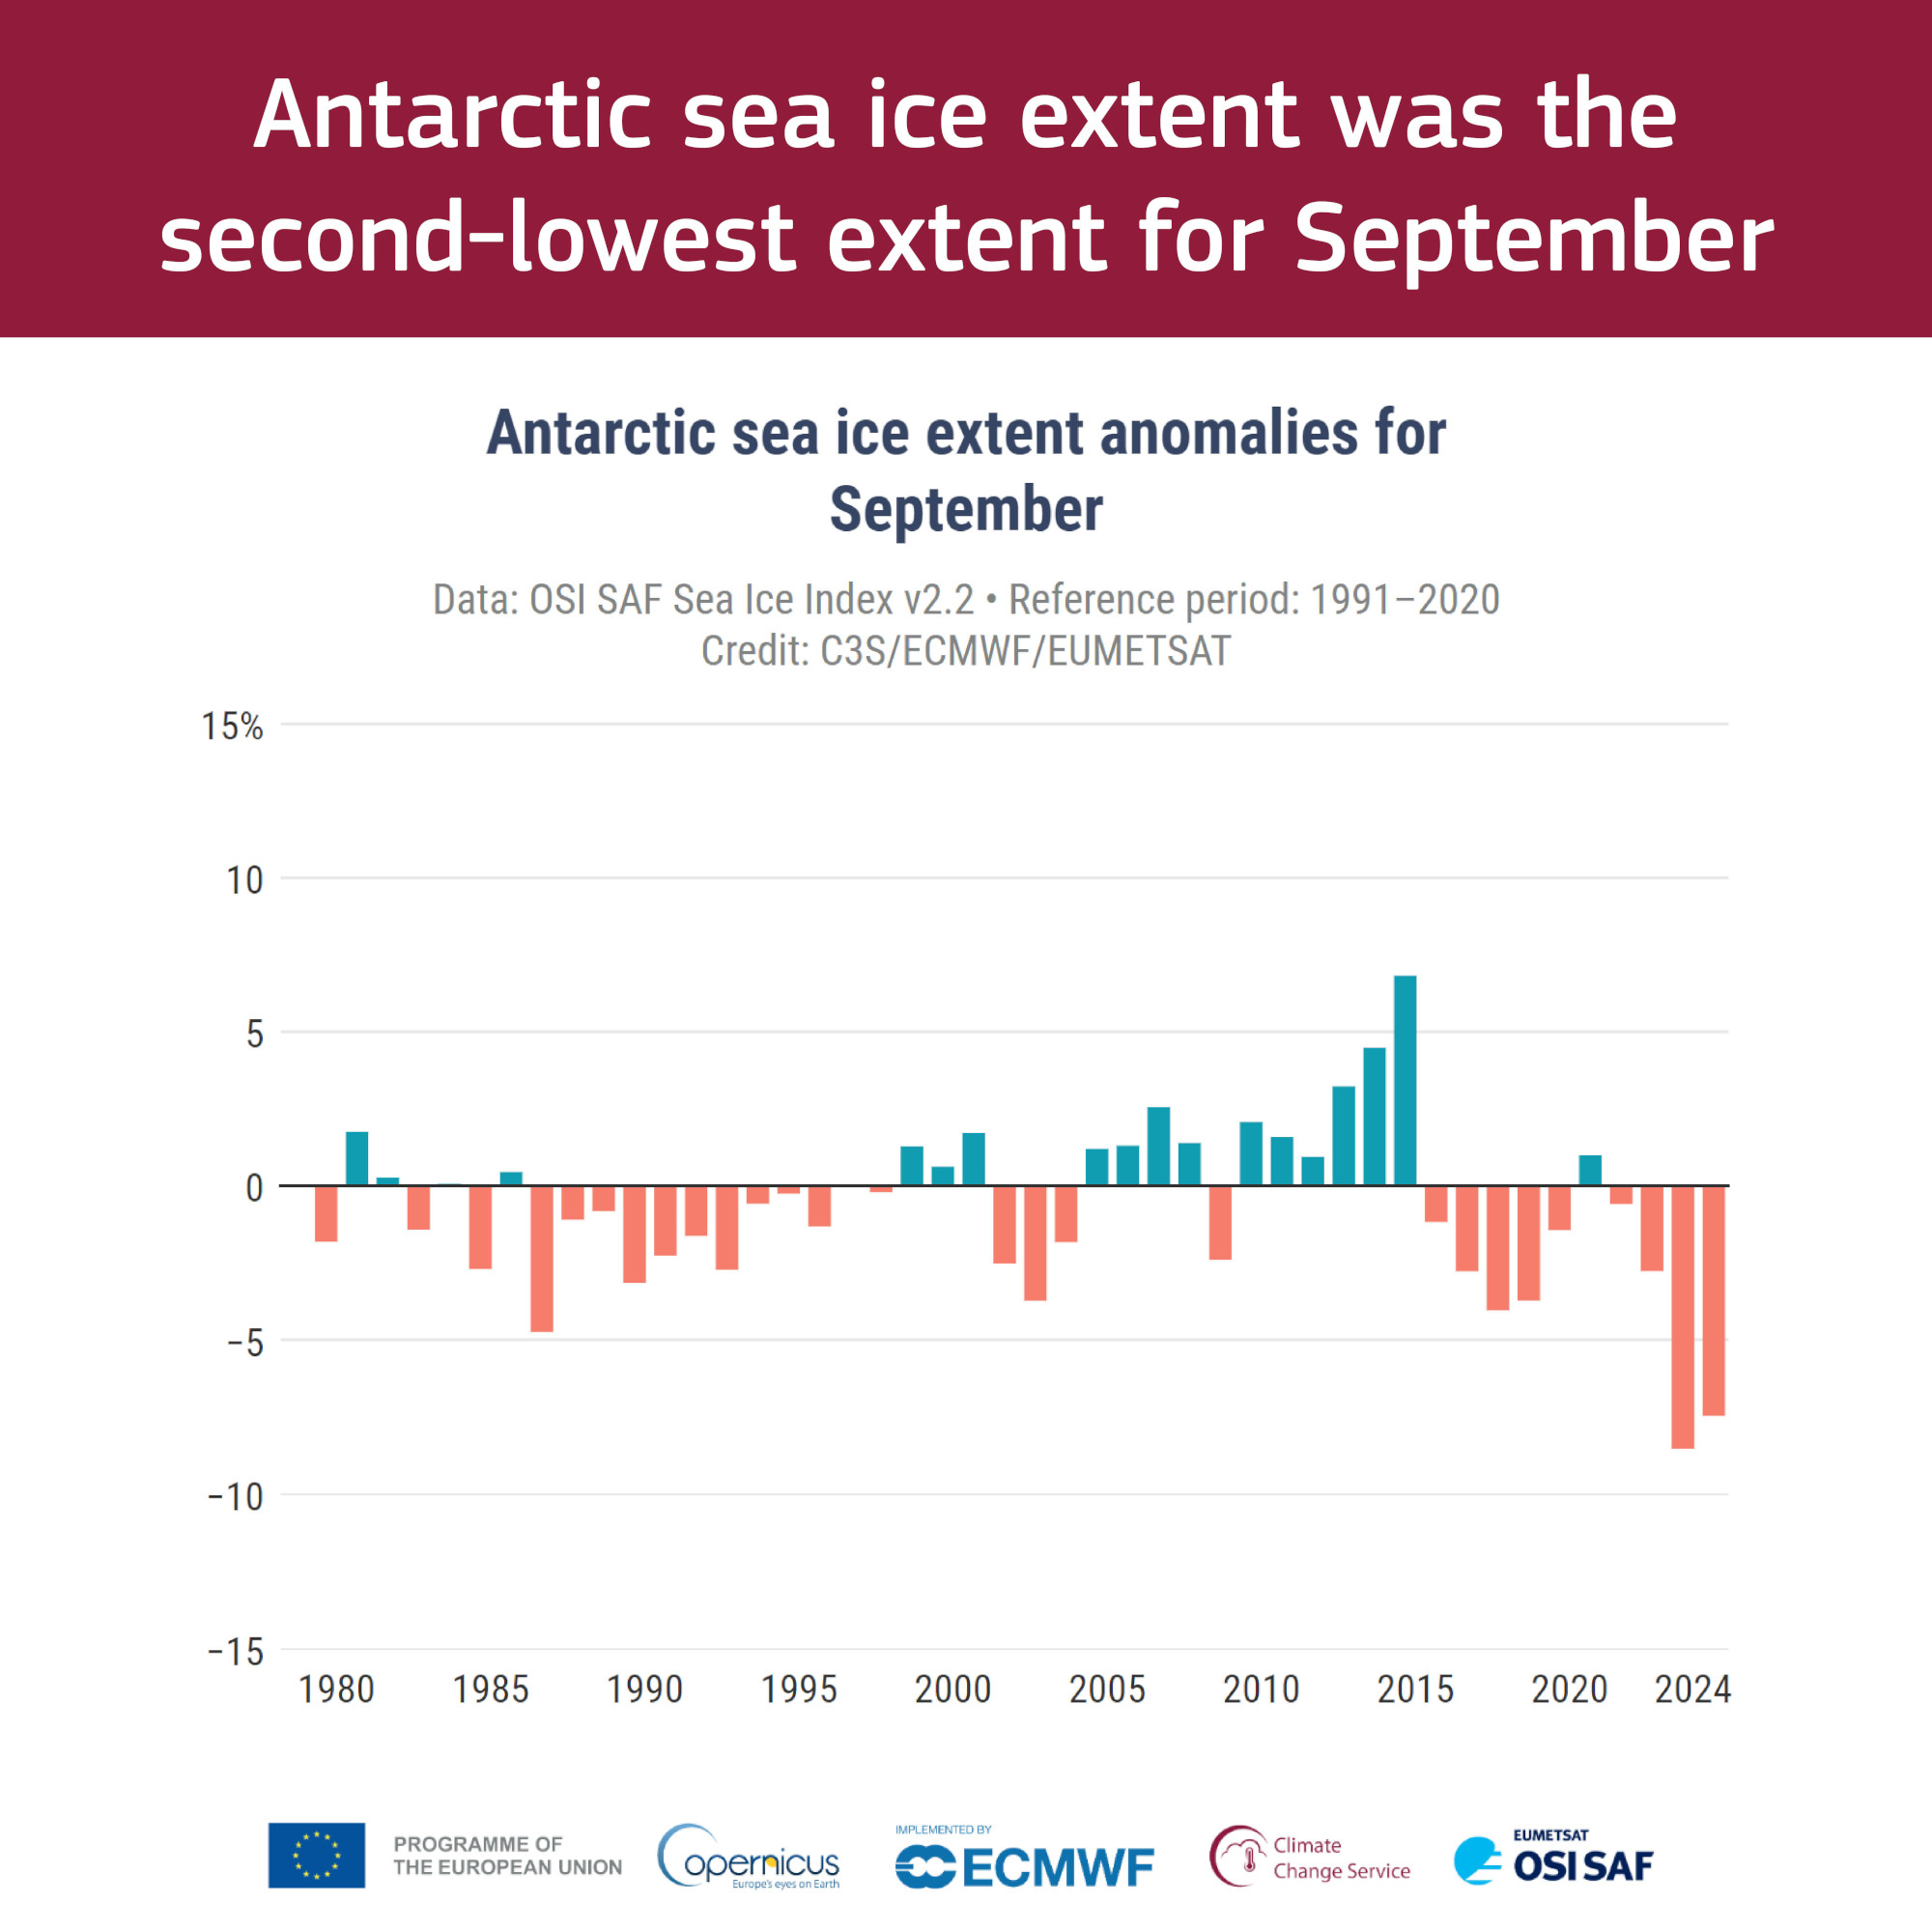
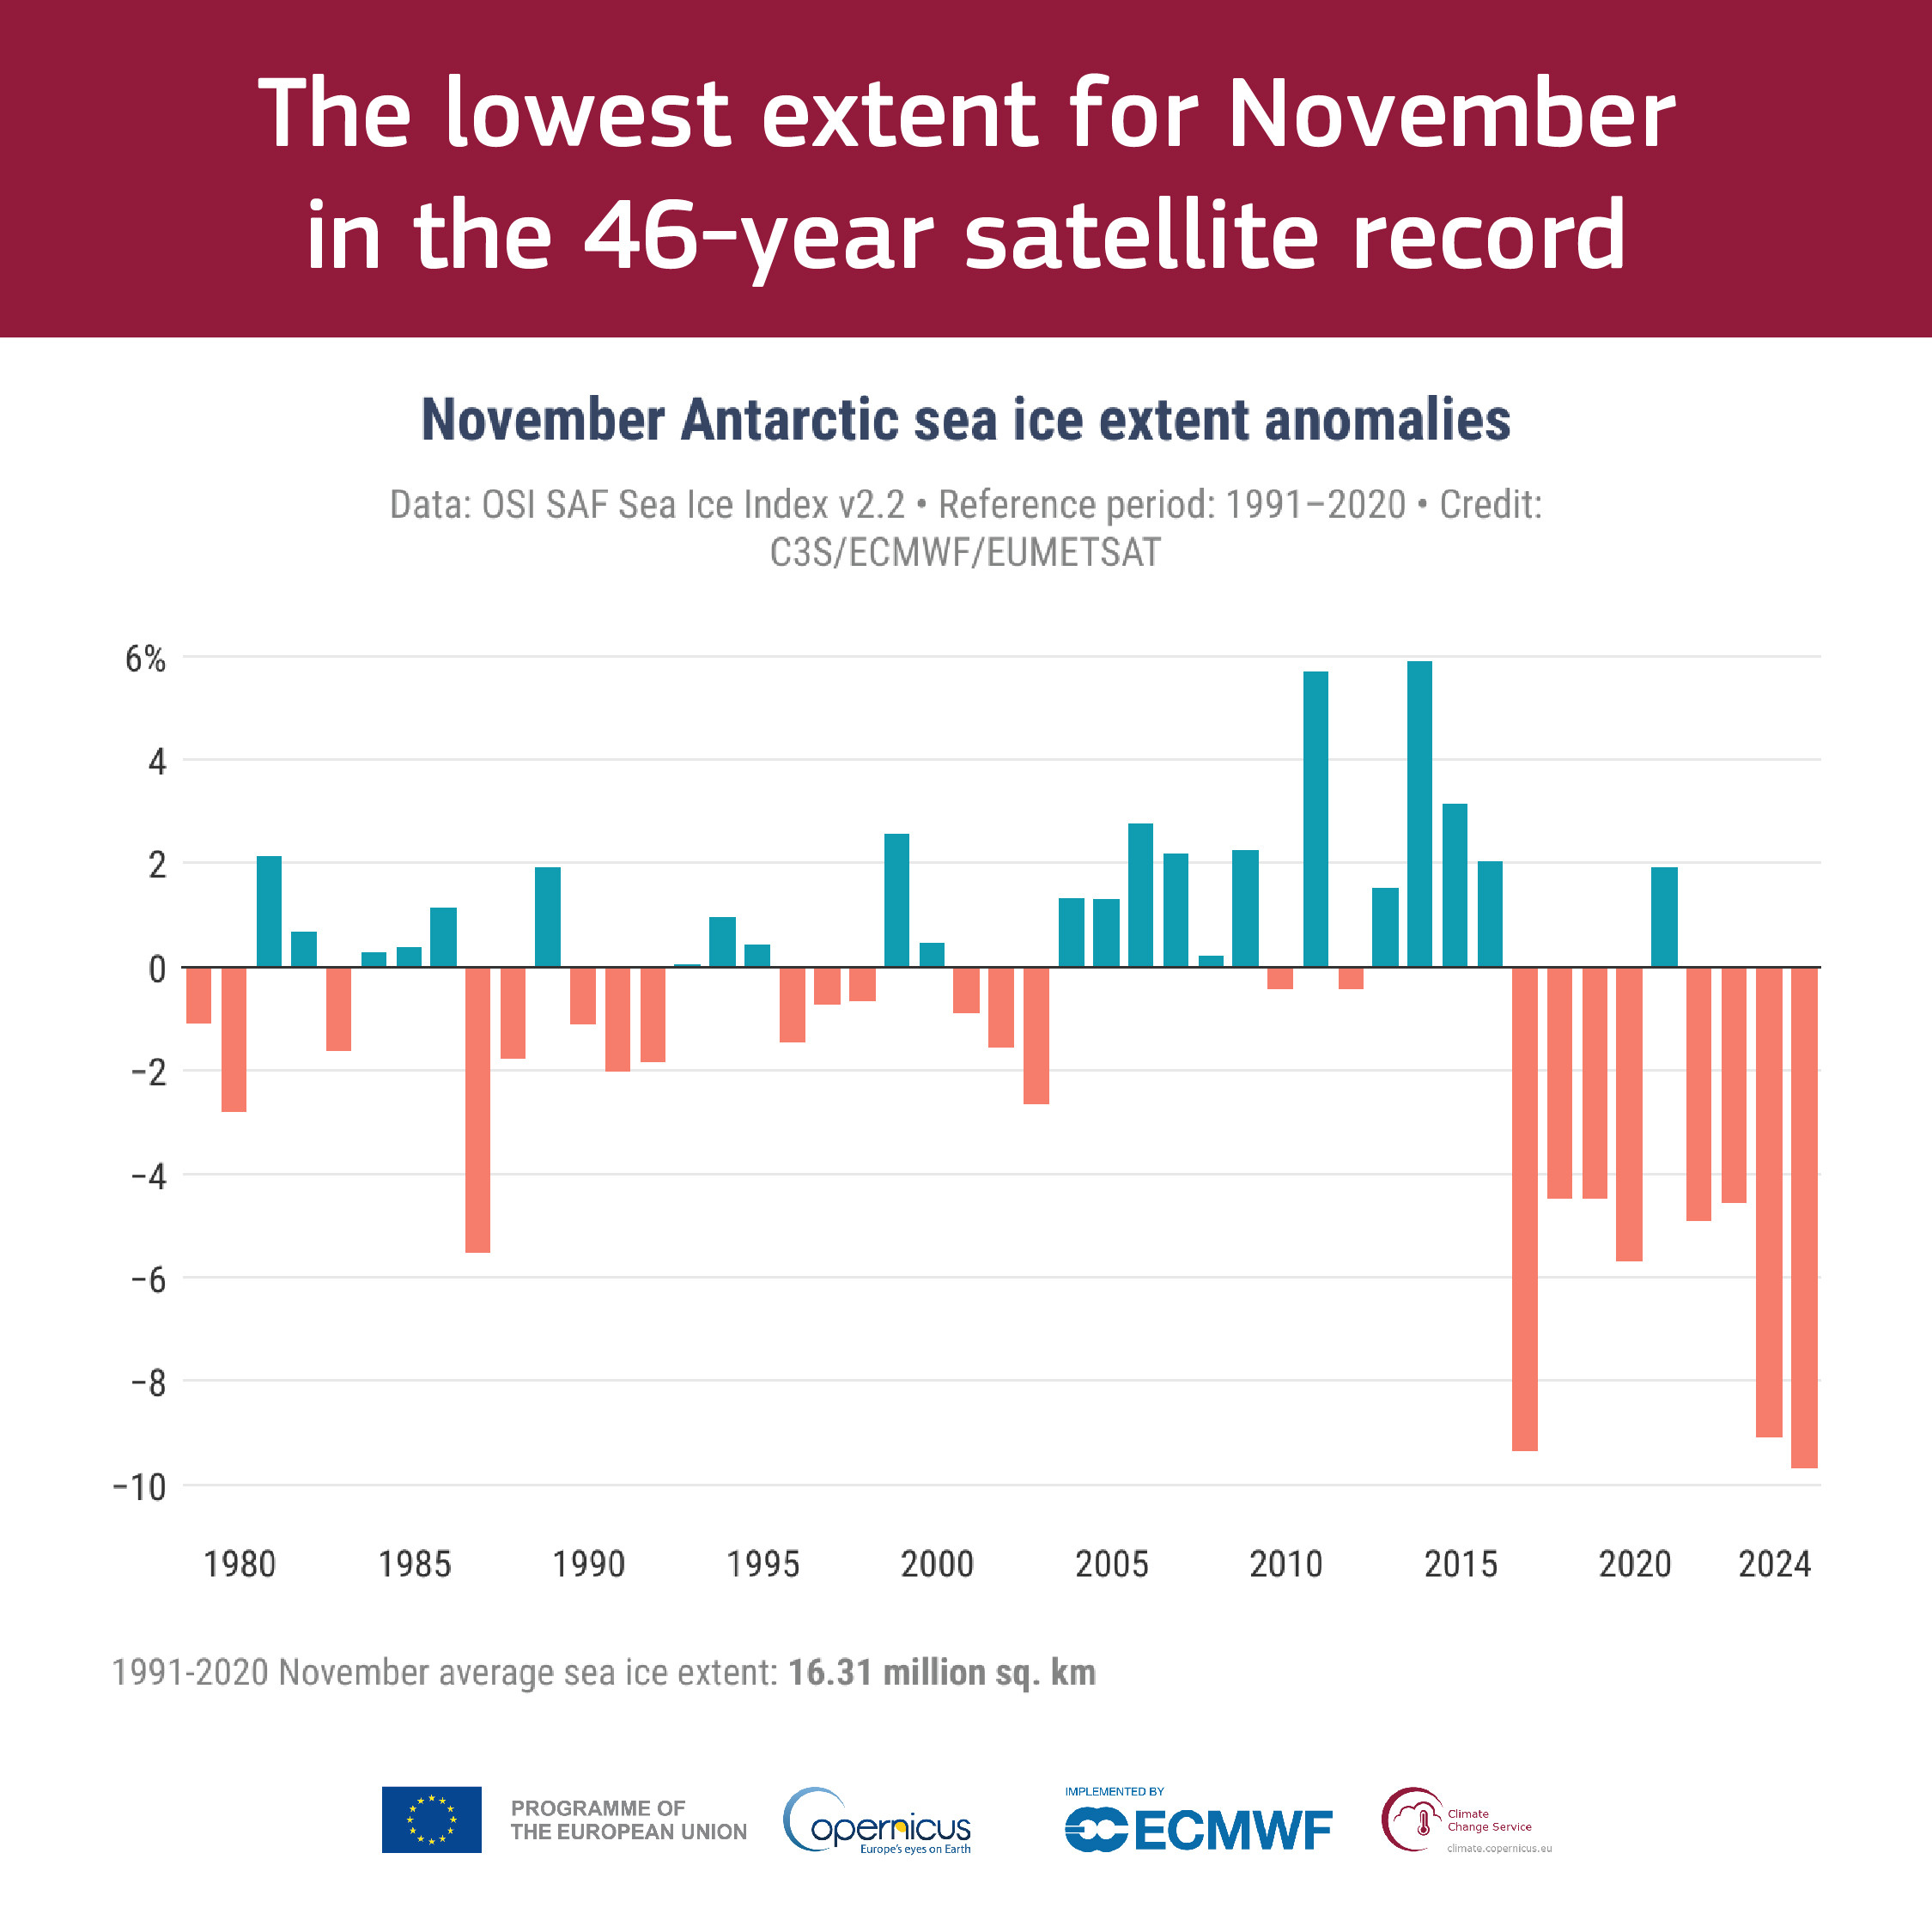
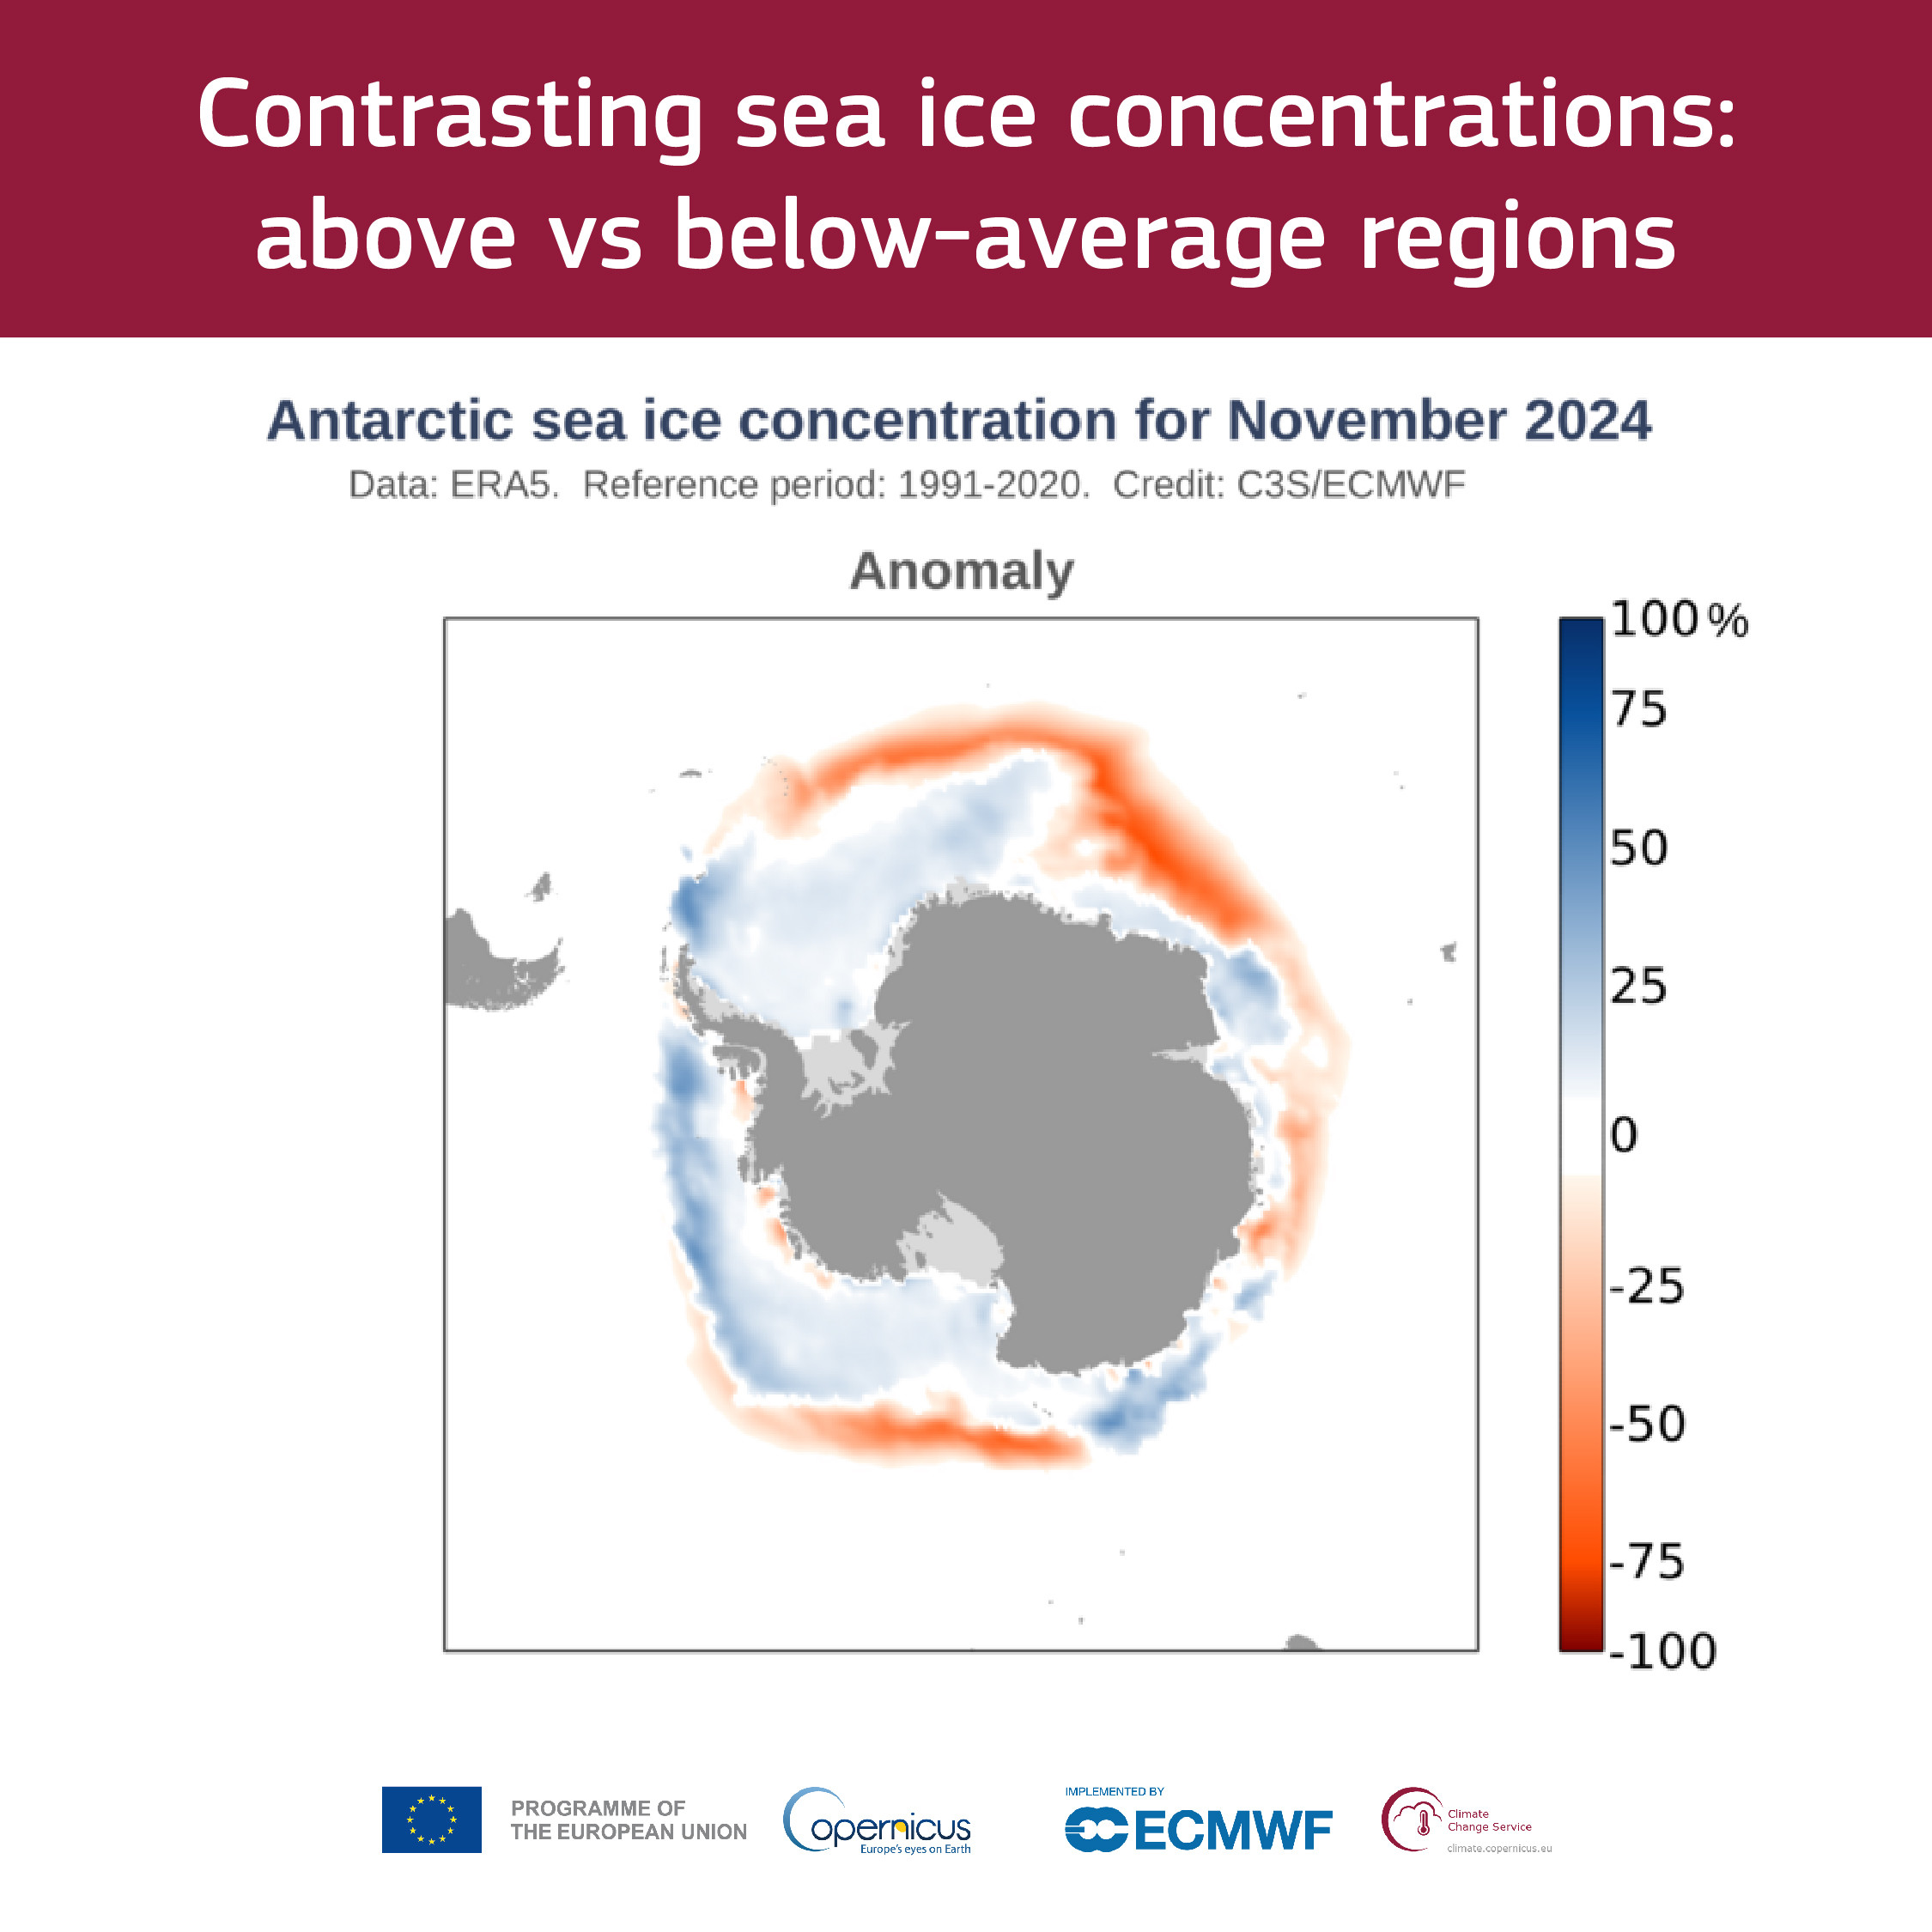
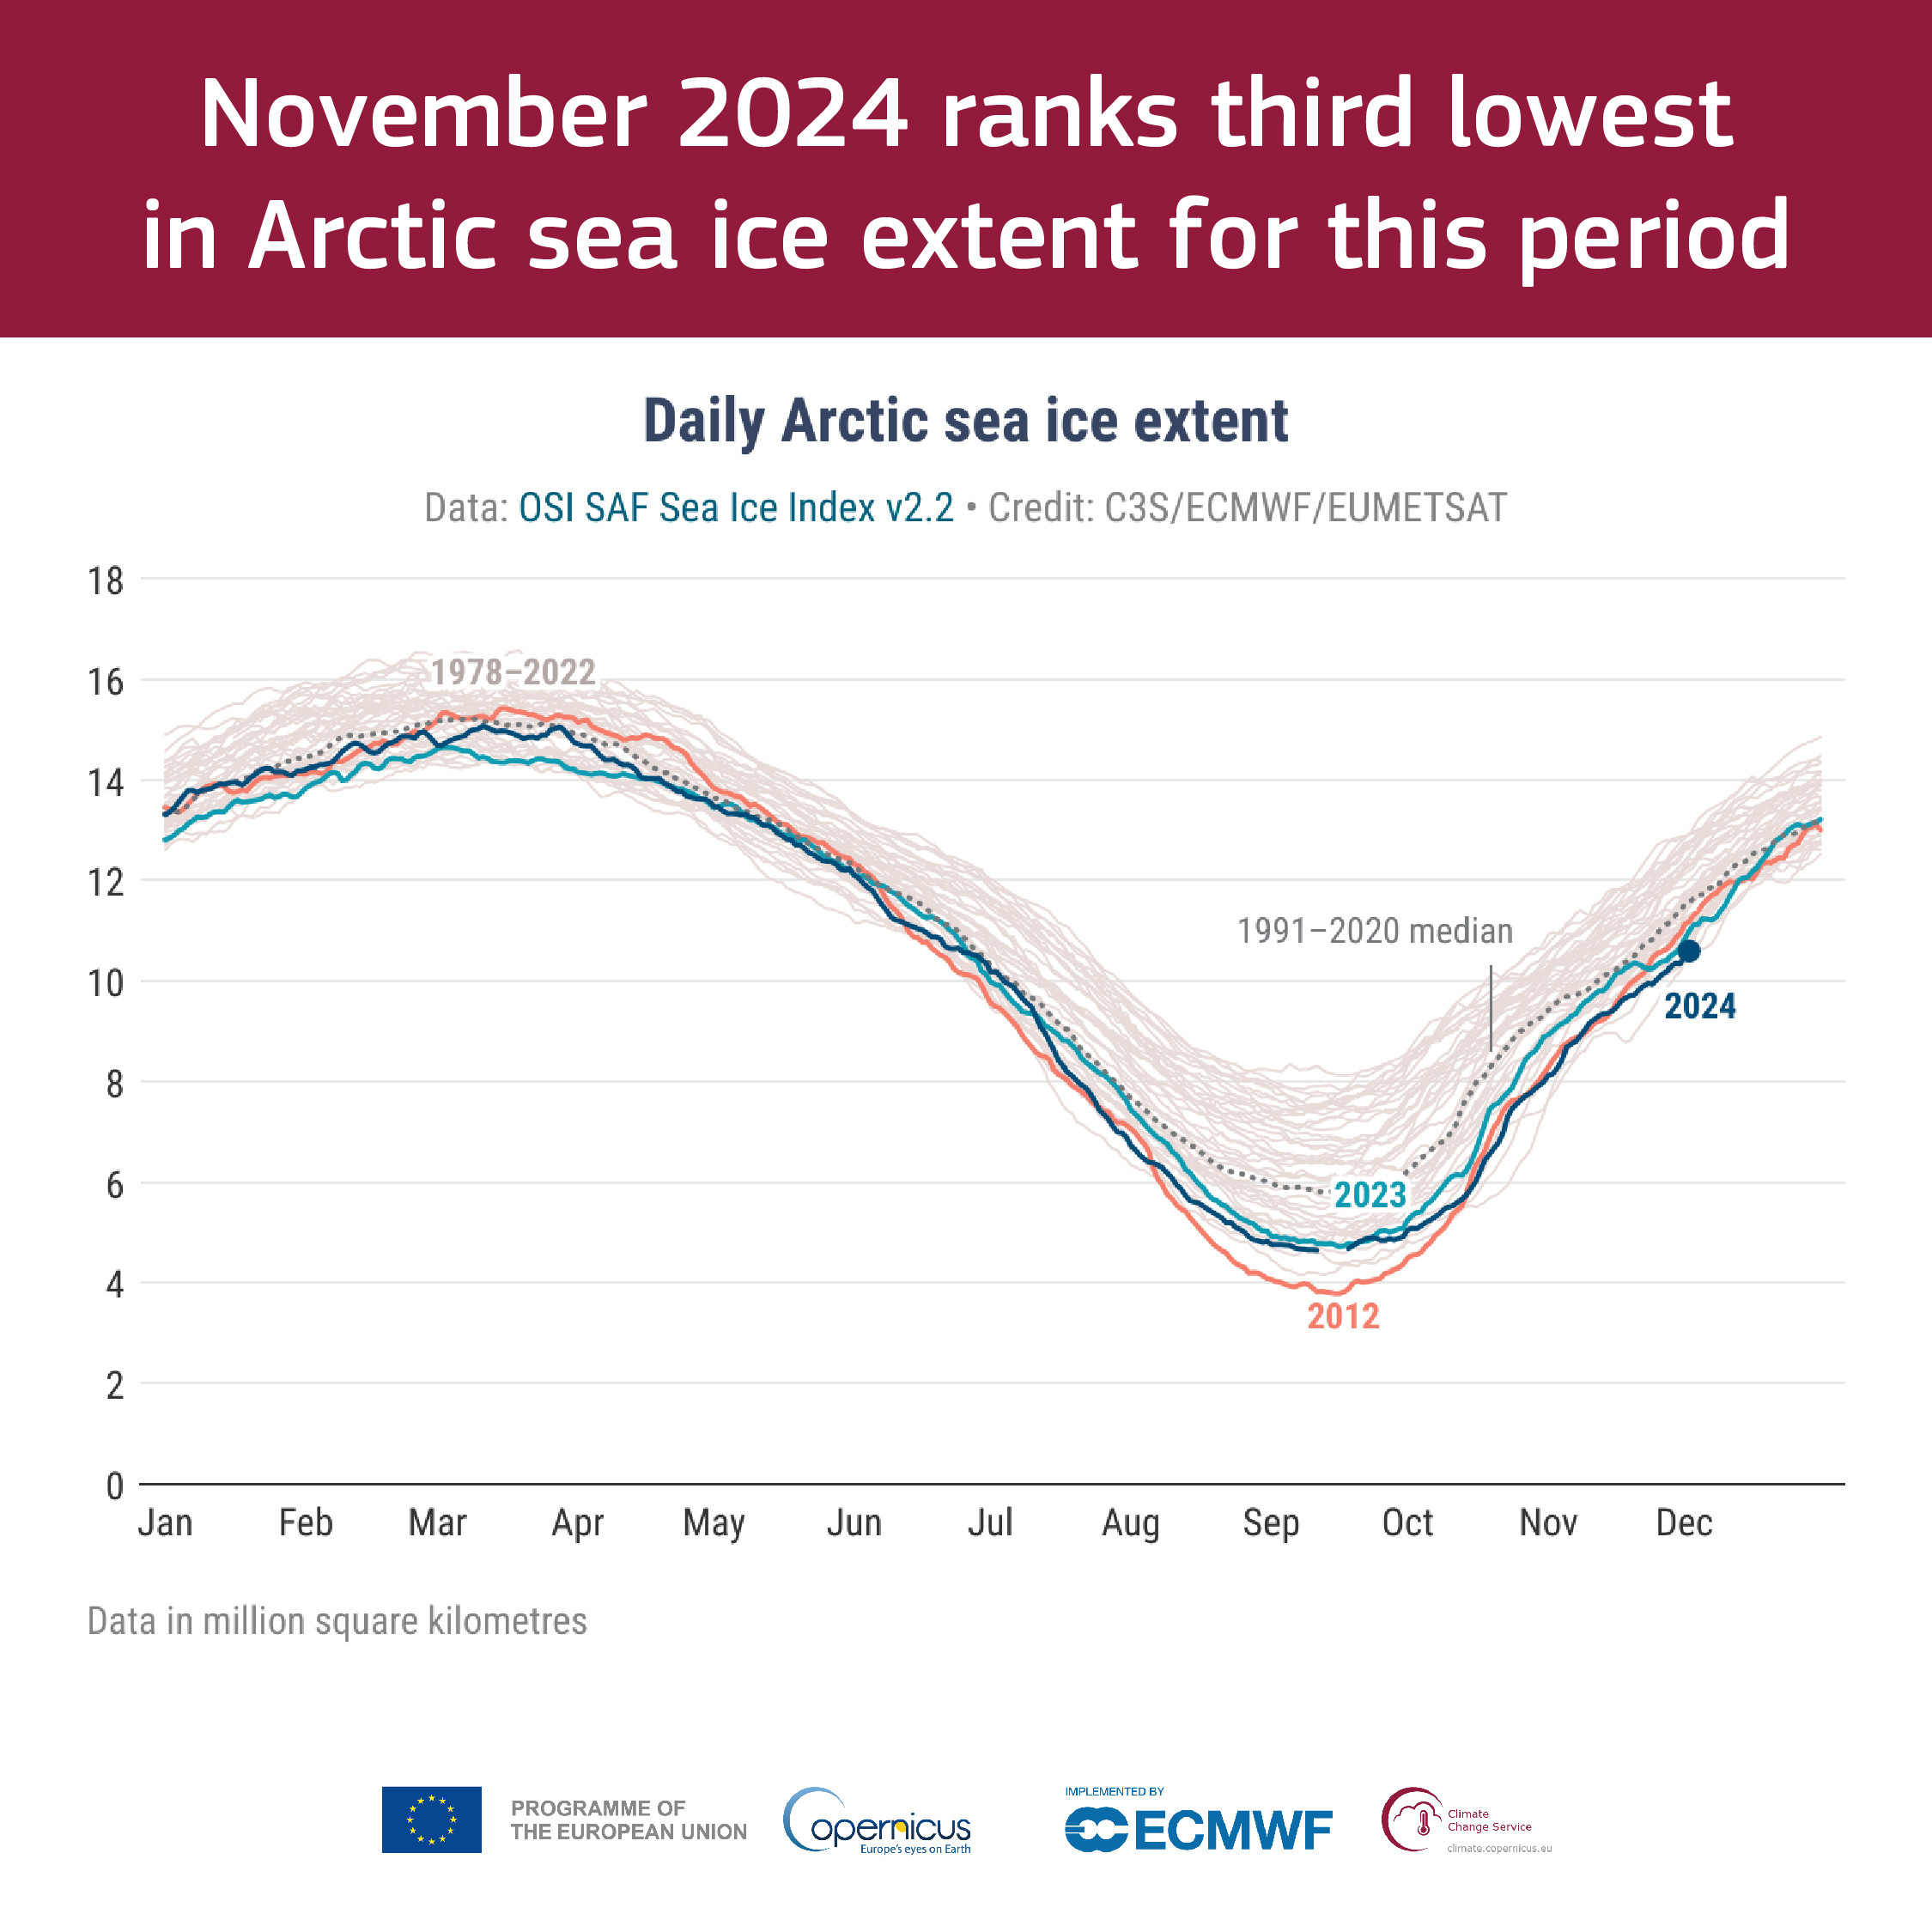
November 2024 saw Antarctic sea ice at a record low for this period with 10% below average, while Arctic sea ice was 9% lower. Dive deeper into the full #C3S Climate Bulletin and discover more on these anomalies compared to past decades: #CopernicusClimate
November 2024 #C3S Climate Bulletin: it was the second-warmest November globally on record. Findings: 🌡️ +0.73°C above 1991-2020 average 🔥 on track to be the warmest year on record 🌊 Sea surface temperature second highest value All details: #CopernicusClimate
The C3S global temperature trend monitor is back and improved, based on the new Climate Data Store technology. Explore it here: Why we talk about 1.5°C:
Are we already breaching the Paris Agreement this year? No, but... While it is almost certain that 2024 will be more than 1.5°C above the pre-industrial level, the limit set by the PA applies to a long-term average of at least 20 years. But, since COP28 in Nov 23, the estimated date has moved 17 months closer, from Nov 31 to Jun 30. You can explore how the estimation of the time to 1.5°C has changed with our new improved C3S global temperature trend monitor image
It is virtually certain that 2024 will be warmer than 2023, making it the warmest calendar year on record. It is also almost certain that 2024 will be more than 1.5°C above the pre-industrial level. It is likely, though less certain, that the it will be more than 1.55°C. The year-to-date global-average temperature anomaly (for January–October) is 0.71°C above the 1991-2020 average, which is 0.16°C warmer than for the same period in 2023, the current warmest calendar year. 🧵 image
Add Climate Extremes, a new documentary about critical tipping points, to your weekend watch list. Now streaming for free on YouTube:
September #SeaIce highlights from the #CopernicusClimate Change Service (#C3S): ❄️ #Antarctic sea ice extent was 7% below average, the 2nd-lowest for Sep on record ❄️ #Arctic sea ice was 19% below average, ranking 5th lowest for Sep on record For more 👉
This year Greece recorded the highest wildfire emissions for September in our #CopernicusAtmosphere dataset (since 2003). The fire radiative power chart shows the exceptional intensity of the fires in the last days. 📉 Check our dataset: ads.atmosphere.copernicus.eu/datasets/cam... image
🔥Wildfires have continued to burn in central regions of #SouthAmerica throughout the August-September fire season, severely impacting #AirQuality across the region. We have compiled the most significant data in our latest article:
🔥🇵🇹 Smoke from the current deadly wildfires in Portugal can be seen being blown out to the North Atlantic over the coming days in our #CopernicusAtmosphere aerosol optical depth forecast from 17 September. See the latest charts at