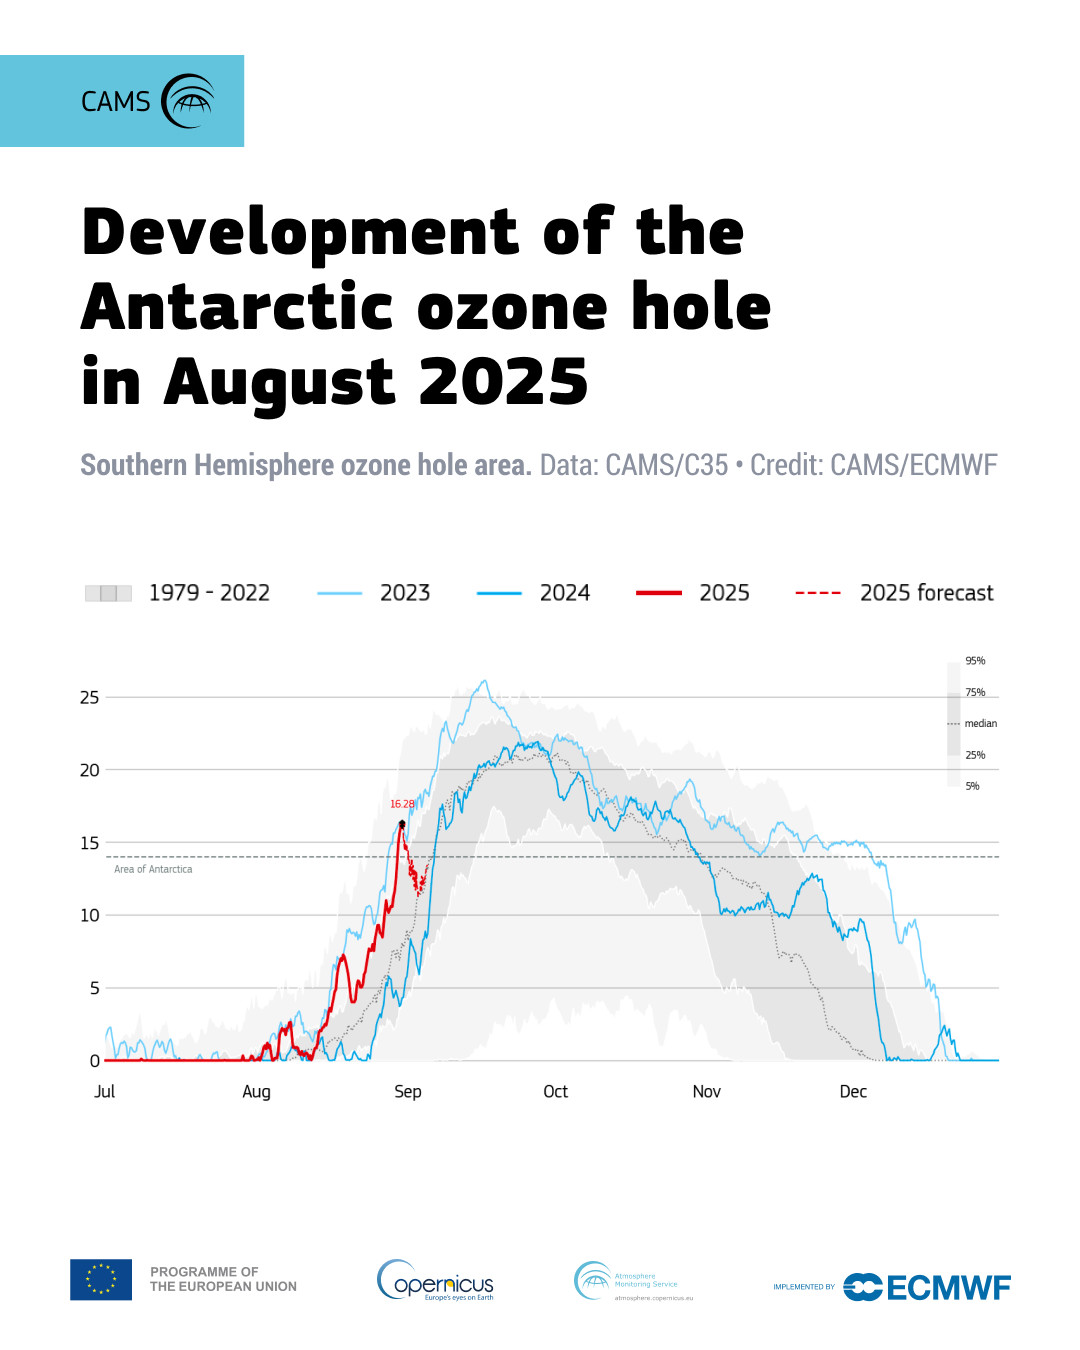
The 2025 Antarctic ozone hole has been developing since the beginning of August, reaching an area of 15 million square kilometres by the end of the month, a few days earlier than the 1979-2022 average. Read more and follow the development at image
Ever wondered how heat stress is changing where you live? With the new Thermal Trace app from #CopernicusClimate and #ECMWF, you can explore “feels-like” temperatures, track heat stress categories and thresholds, and visualise interactive charts for your city. Read more about it 👉 Explore the app:
Have you explored the July 2025 #C3S Climate Bulletin? It was only the fourth month in the past 25 months with a global-average surface air temperature below the 1.5°C threshold; climate-related events from floods to wildfires continued. Get the details in our summary 🔗 image
🌡️ Two major heatwaves impacted Europe in June, with western Europe as a whole recording warmest June on record. The western Mediterranean Sea recorded its highest-ever June SST. Read the article #C3S
📣 Big update for the Methane Hotspot Explorer app from #CopernicusAtmopshere! New features include #methane plumes, a wind layer, and data on coordinates, emission rates and more. Monitor and explore methane hotspots all over the world. 🔗 The new interface uses observations from the Tropospheric Monitoring Instrument (TROPOMI) on board the Copernicus Sentinel-5 Precursor satellite, processed by SRON, to provide an enhanced understanding of methane hotspot plumes.
Our latest animation, based on #CopernicusAtmosphere data, captures the intricacies of aerosol emissions and atmospheric dynamics observed in Europe during 11 and 16 June 2026. Read the article:
Three charts based on #C3S data you shouldn’t miss this month: 📈 April 2025 was the second warmest April globally on record – #C3S 1️⃣ Dive into the bulletin: image
It's Europe Day! Today we honour #C3S and #CopernicusAtmosphere for their pivotal contributions of data and tools to help better understand climatic and atmospheric conditions in Europe. #EuropeDay
Three charts based on #C3S’ ESOTC report you shouldn’t miss this month: 📈 Distinct east-west contrast in sunshine in 2024 – #C3S 1️⃣ 📈 Ice loss of the Talèfre Glacier in the French Alps between 1967 and 2015 – Copernicus_EU 2️⃣ / 📈 Anomalies and extremes in annual average river flow in 2024 – The Guardian 3️⃣ Explore the full European State of the Climate Report: